Looking at where the highest relative increases occurred in mortality in 2021 in the U.S. (age 40-44), the causes that drove it (different for different age groups), and thinking about how that may influence future mortality trends.
Related Links
Key graph of relative change in mortality
Gen X Trend:
Millennial Trend:
Links to posts on key causes of death and their trends
Suicide
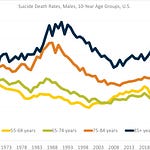
Suicide: Trends, 1968-2020, and Provisional Counts Through June 2021 – this one had only one standalone post, but I’m not done with this topic yet.
Mortality Nuggets: Videos on Suicide Rate Trends, Society of Actuaries Report, and Fixing Their Graph — there are a variety of mortality trends covered in video form here, and suicide rate trends are in the first video.
Homicide
Homicide: Trends, 1968-2020, and Provisional Counts Through June 2021
The Geography of Homicide — States, Base Rates, Increases, and Correlations
Motor vehicle accidents
Motor Vehicle Accident Deaths: High-Level Trends, 1968-2020, Part 1
Motor Vehicle Accident Deaths, Part 2: Age-Related Trends with Provisional Results in 2021
Motor Vehicle Accident Deaths, Part 3: Geographical Differences, 2019 vs 2020
Drug overdose deaths
Drug Overdoses, Part 1: High-Level Trends, 1999-2020
Drug Overdose Deaths, Part 2: U.S. Age-Related Trends 1999-2020 with Provisional Results in 2021
Drug Overdose Deaths, Part 3: Geographical Differences for 2019 and 2020
Alcohol-related deaths
Part 1: Dead is dead: Increased Alcohol-Related Deaths, U.S., 2020-2021
Part 2: Alcohol-related deaths, part 2: Geographical Differences for 2019 and 2020
As a reminder, I have a Mortality with Meep category, if you want to only look at mortality-related posts (I do write about other things, like public finance).


Share this post