


Drug Overdoses, Part 1: High-Level Trends, 1999-2020
Drug ODs increased 35% in 2020 on an age-adjusted basis

Before I begin this last of the nasties (for now), I want to mention that on my substack, I figured out how to do some semblance of organization. I have been able to mark out the mortality-only posts with Mortality with Meep, in case you want to focus only on death.
Separately, I have been trying out doing a weekly podcast on the substack, called STUMP: Death and Taxes. It’s difficult to say which of the two topics are more depressing.
And now, let’s get to my least favorite of the “external” causes of death: accidental drug overdoses.
High-level trends of crude rates and age-adjusted death rates for drug overdoses
Here is our standard graph:
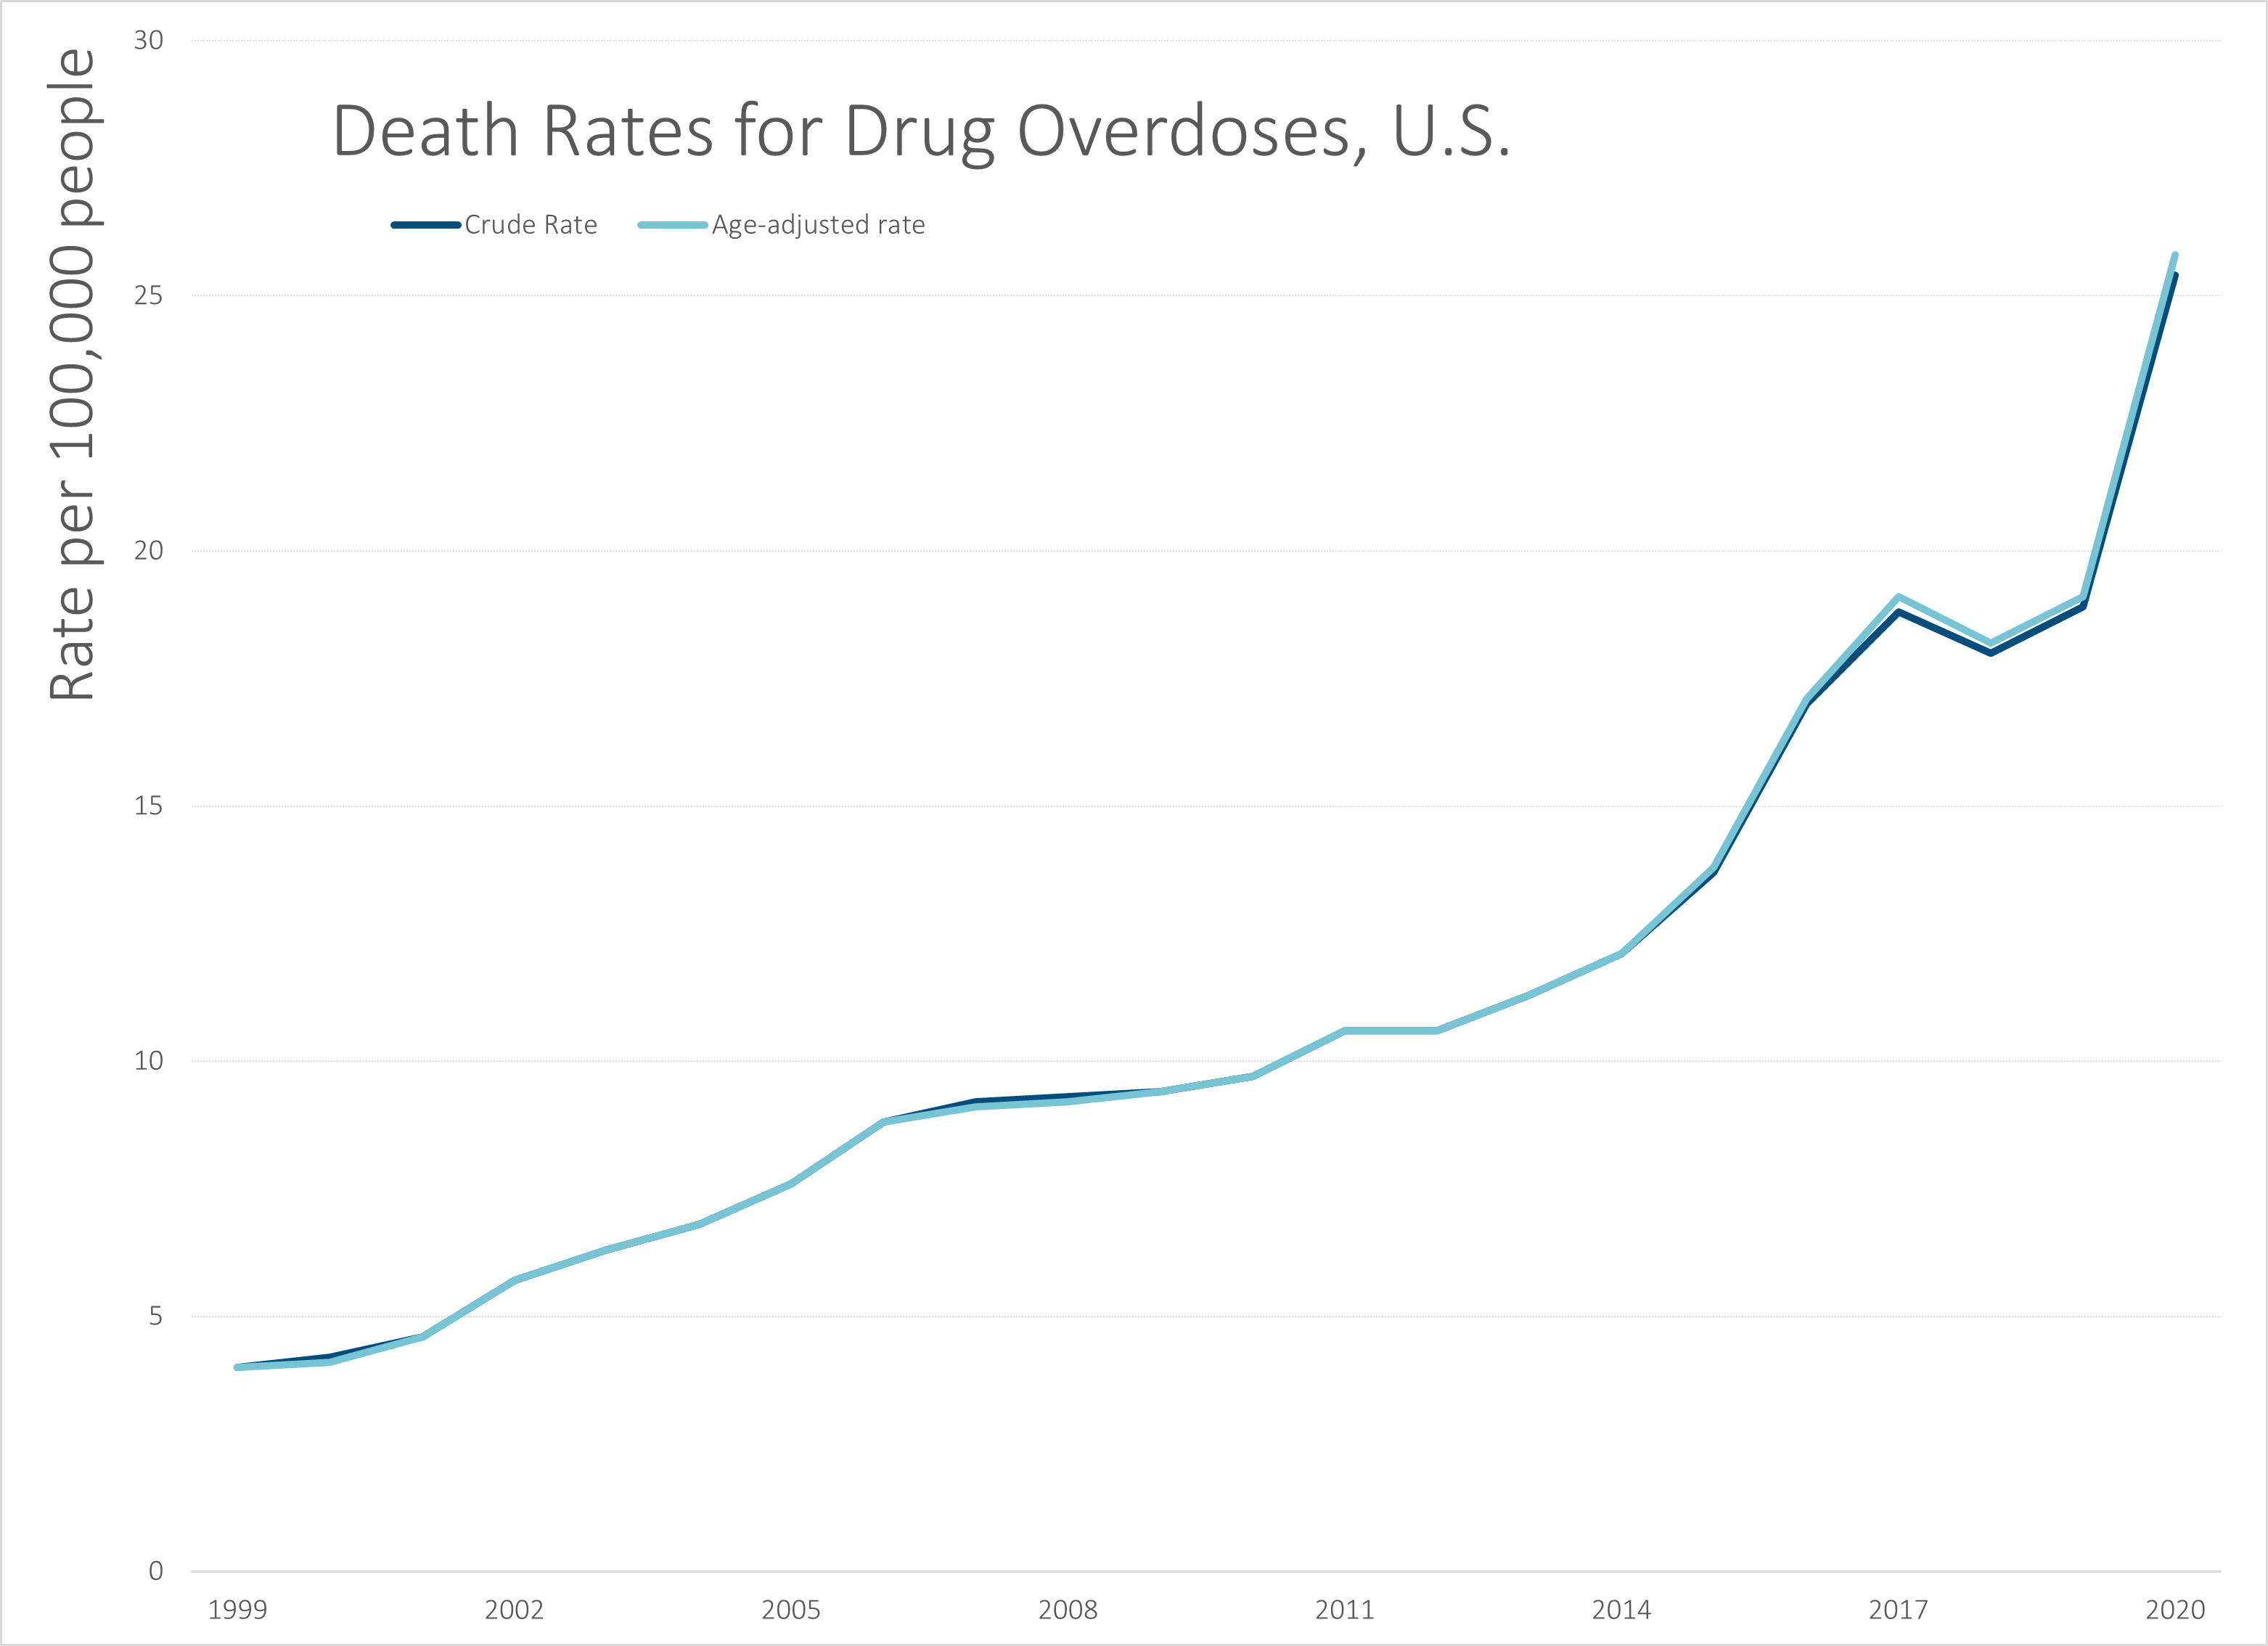
I will note that the crude rate and age-adjusted rate are basically the same for almost every year.
Your first question may be why I am graphing only from 1999-2020, and not going back all the way to 1968 as I did with the other causes of death.
I have two reasons. I did pull data from period periods, using prior death codes, and had trouble matching up numbers. I got discontinuities between ICD-9 (the 1979-1998 database) and ICD-10 (1999-2020 database) in particular, so couldn’t really do good comparisons between those trends.
But I could deal with some minor discontinuities, if it was worthwhile to make the comparisons, and it’s not other than to say the drug overdose rate was very low before recently.
Accelerating growth rate in recent years
The second reason was that before 1999, drug overdose trends were not much of a trend. It may be that they were coded under something else (I don’t know), or perhaps patterns really did change. But we also have some evidence that this is one cause of death that has gotten worse, unlike many others.
Let me annotate the graph, with some longer-term growth rates. I could do a year-over-year percentage growth rate graph, but that will be very noisy due to precision limitations. I think I’ve captured pretty well the “bend point” occurring around 2014:
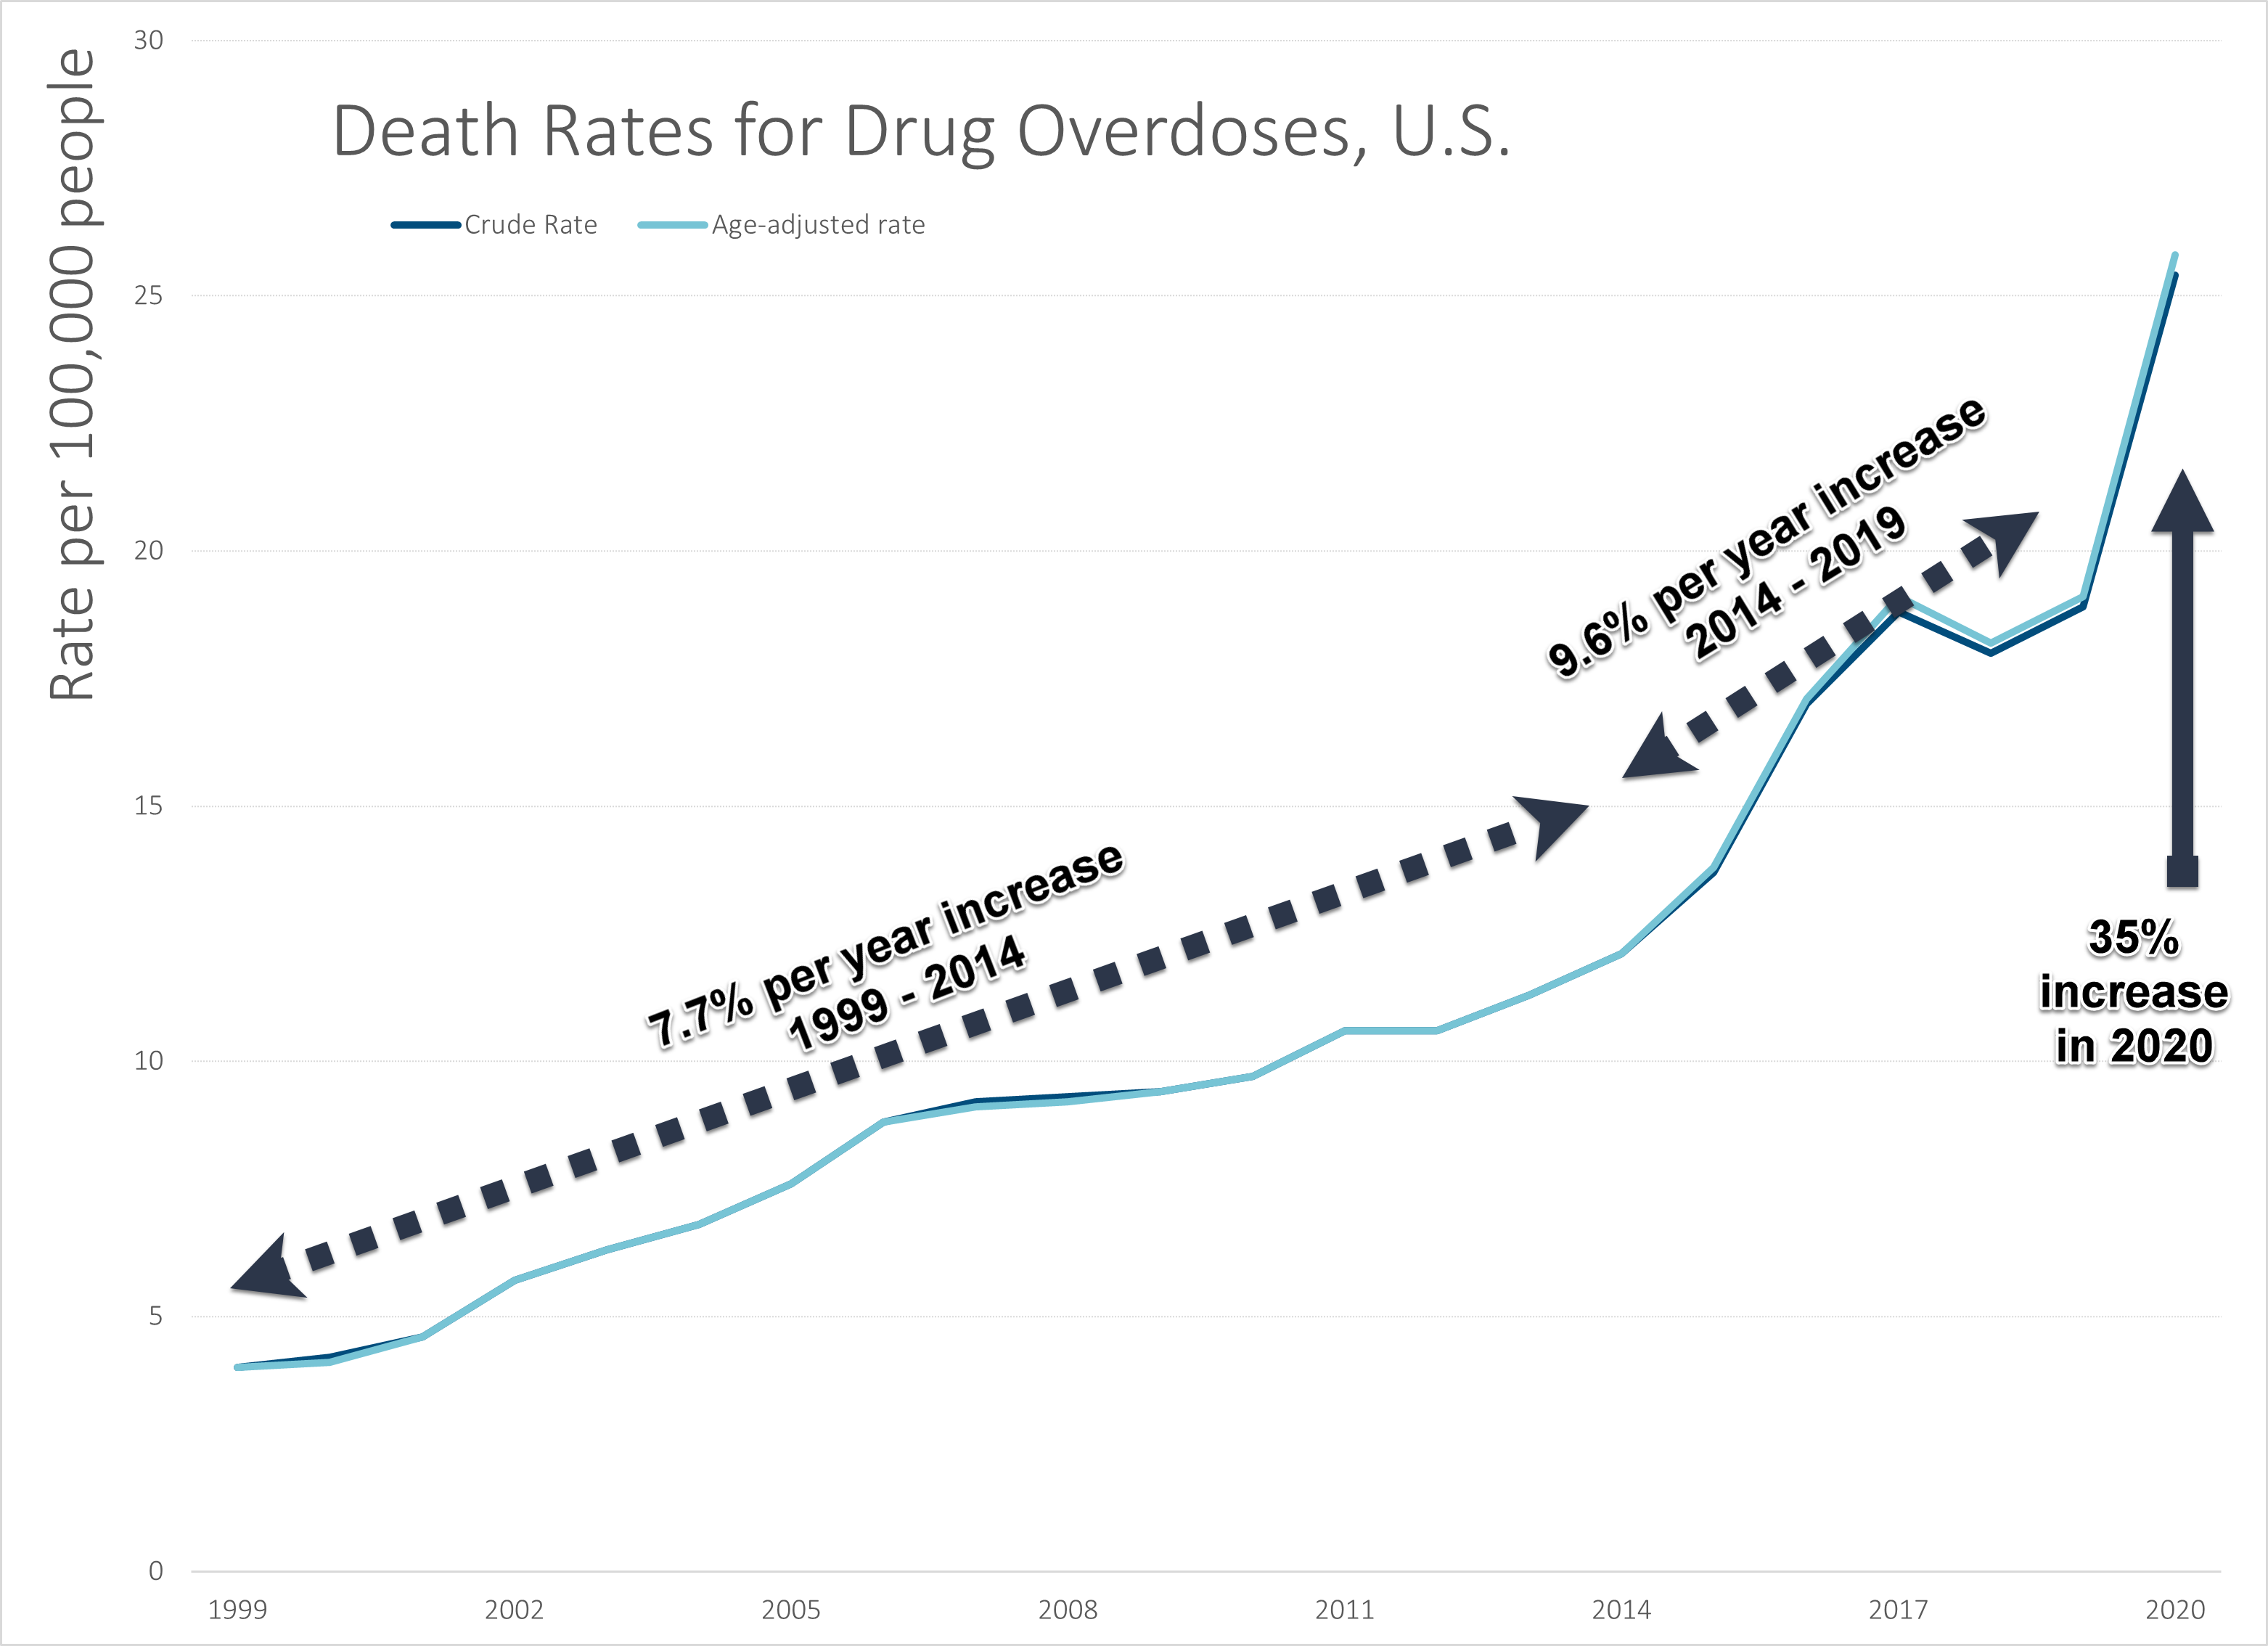
Yes, a 35% increase in 2020.
This has been the worst increase among the external causes of death that I’ve looked at so far.
Heck, it’s one of the worst increases for any of the major causes of death, including natural, but excluding COVID (because we didn’t have COVID as a cause for 2019).
Oh, and yes, that 9.6% per year increase for 2014-2019 does take into consideration the “stall” for 2018/2019.
It has been an extremely nasty time for drug overdoses. I may talk about causes later, but I think the “deaths of despair” is a little too facile, given some of what I’ve seen in the data, and we’ll see that in later parts. It’s not necessarily due to despair due to lack of money. These deaths are occurring at all income levels.
Sex and racial/ethnic patterns are not necessarily what you expect
As my data set covers only 1999-2020, I have the full breakout:
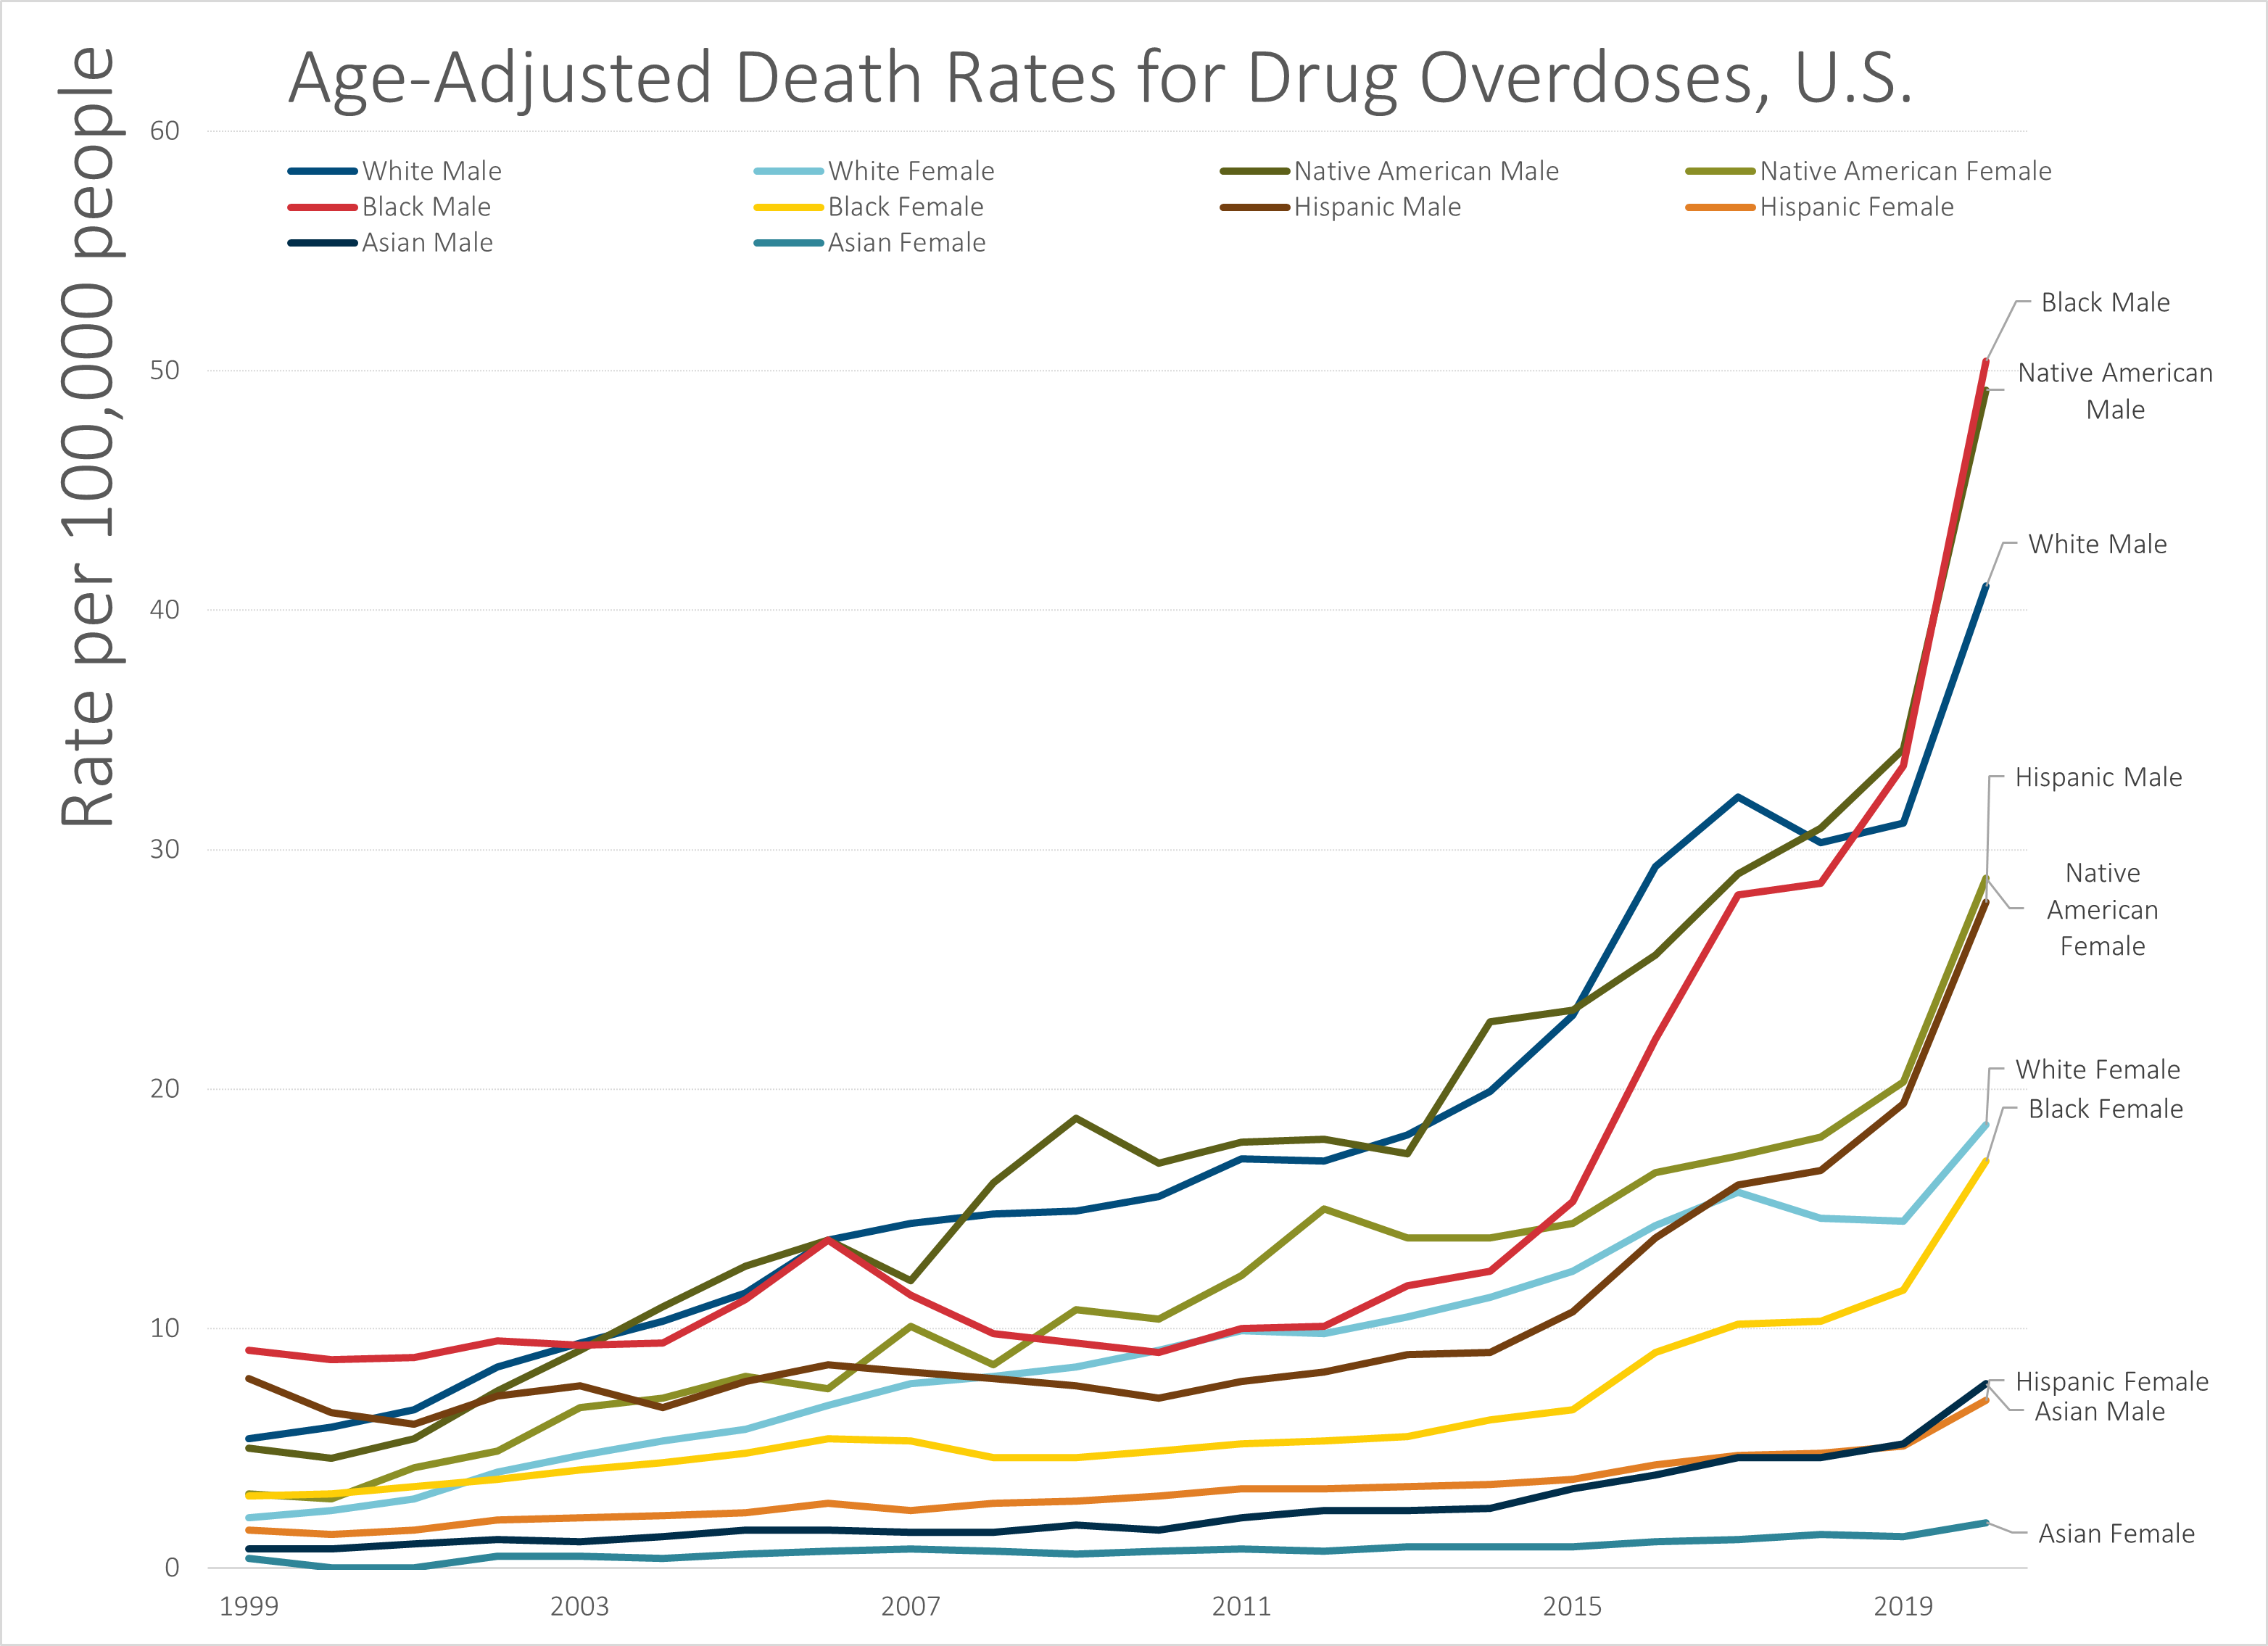
In looking at this graph, you need to look at pre-2020 separate from 2020.
Pre-2020, the worst drug overdose rates were white males and Native American males. In 2020, black males and Native American males had the highest rates, with white males just behind. The specific trajectory for black males is interesting, as that curve (in red) is about at the same level as white females for a while.
Below the top three from 2020 are the next two: Hispanic males and Native American females. Pre-2020, they had similar trajectories as white females as well, but increased a great deal in 2020.
White females and black females are the next grouping from 2020, and pre-2020, black females had a much lower rate than white females.
The next two have been relatively low, but have been slightly increasing over the entire period: Hispanic females and Asian males. Asian females have had low rates throughout.
Change from 2019 to 2020: overall 35% increase, no groups decreased
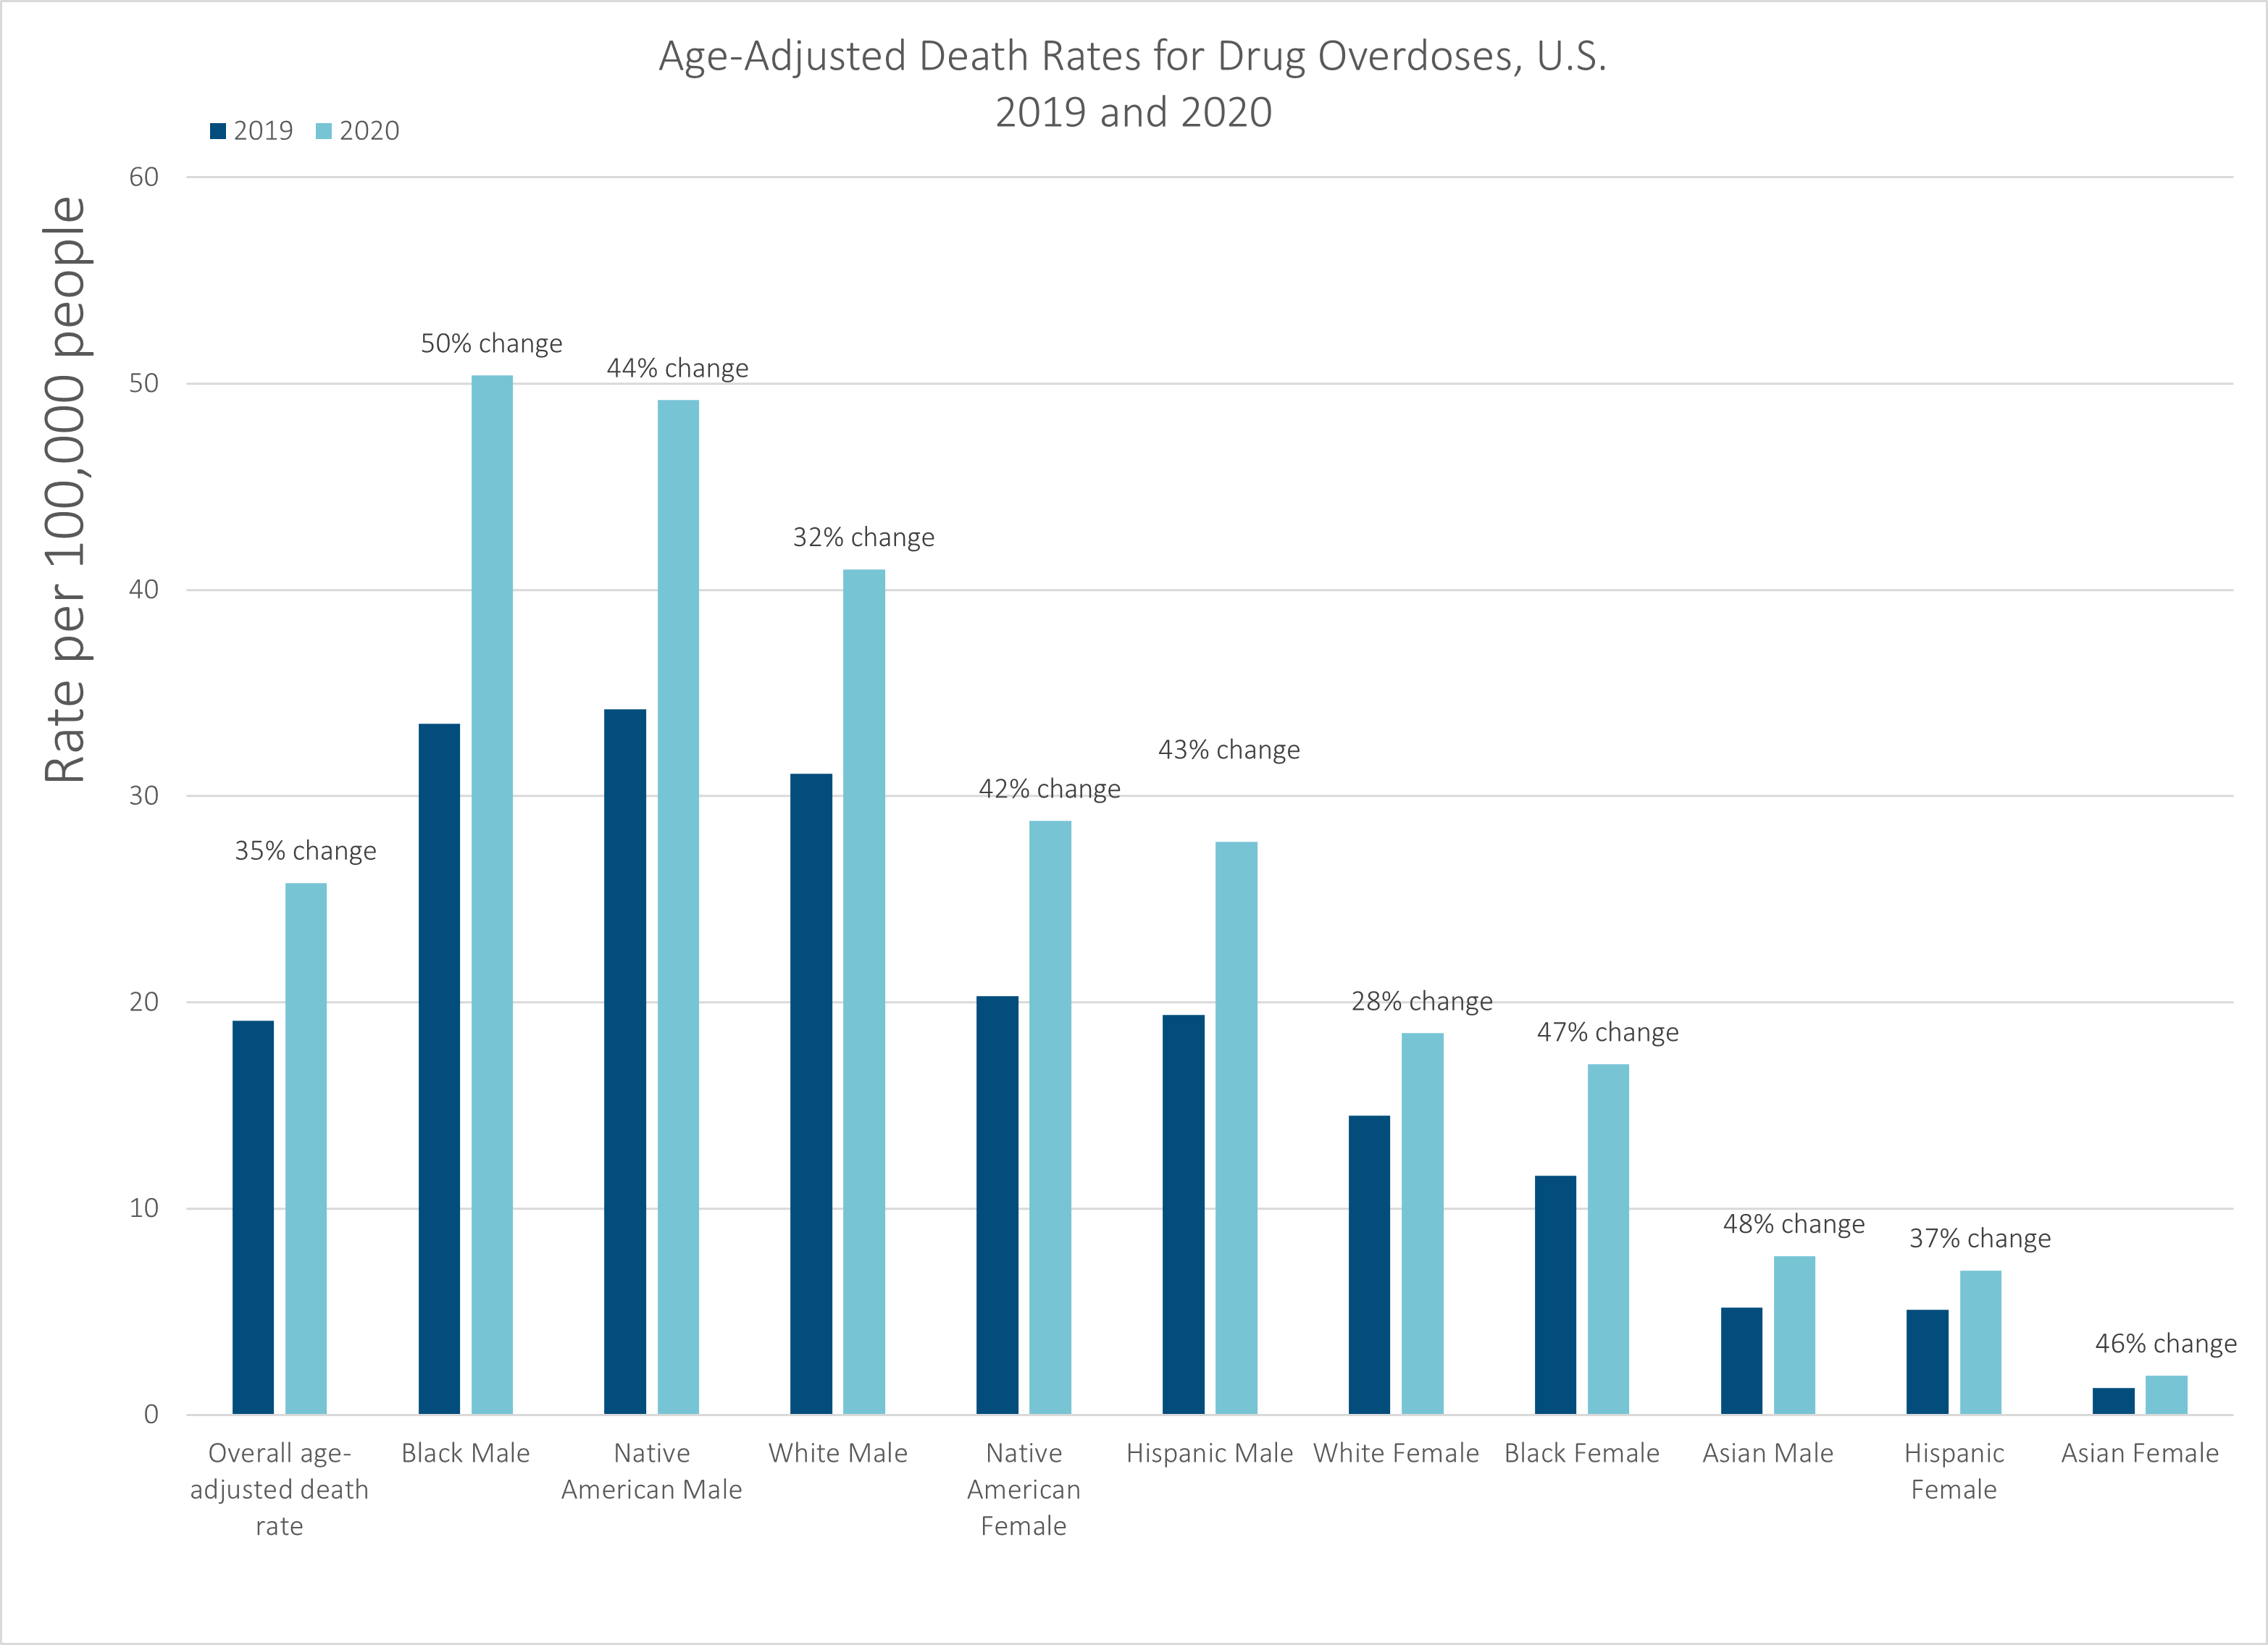
All groups saw substantial relative increases.
When we look at the longer-term trajectories, we can see that all of the groups have had a bad trend. In isolation, just looking at the 2020 result compared to 2019, it’s really bad.
This is extremely depressing.
The problem is, of course, there is no reason to believe that we will see the 2018/2019 trend re-occur once COVID priorities fade away. What fueled the spike in drug overdoses in 2020, and yes, they continued in 2021, may of course continue.
The trend was bad before the pandemic.
It doesn’t seem to be much of a priority now.
Spreadsheets:
I have exciting news to share: You can now read STUMP - Meep on public finance, pensions, mortality and more in the new Substack app for iPhone (and iPod!)

I’ve been trying it out with my own Substack reading list, and it has definitely cut down on the email notifications, which is nice.
The Substack app is currently available for iOS. If you don’t have an Apple device, you can join the Android waitlist here.