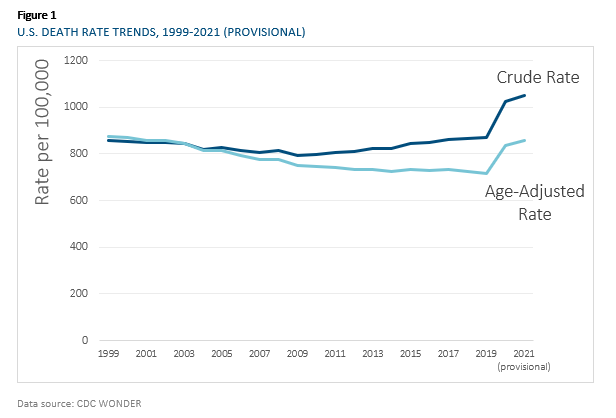
In this episode, I talk about a recent report I wrote for the Society of Actuaries, on provisional data from the CDC on U.S. mortality in 2021, also placing it in context of 1999-2020 finalized mortality data, the three major mortality metrics used, and differences by age and sex in trend.
Episode Links
Report Link
As I write this, the Society of Actuaries website is down for maintenance, so I will link to my prior post, which has my top bullet point takeaways and one graph:
I will put the actual link to the report here when the SOA website once more becomes available.
A few (other) graphs:
And a table:
Mortality through the Pandemic - 2020 and 2021 (provisional)
U.S. life expectancy fell almost 1 year (again) in 2021 - looking at the meaning of period life expectancy
Top Causes
Top Causes of Death in U.S. for 2021 by Age Group
Top Causes of Death for 2021: Heart Disease, Cancer, and COVID
By Age Groups
Children — Age 1-17: Childhood Mortality Trends, 1999-2021 (provisional), Ages 1-17 Revisited: Teen Mortality Increased 30% 2019 to 2021 Under age 1 is infant mortality and requires special handling — I really don’t want to deal with this right now.
Young Adults — Age 18-39: approximately the Millennials in 2020-2021 Part 1 and Part 2, plus the podcast
Middle Agers — Age 40-59: approximately Gen X – Middle-aged Massacre (too!): Increase in Mortality for Ages 40-59 in the U.S. for 2020-2021 Mainly Driven By COVID
Young Seniors — Age 60-79: approximately Boomers – Baby Boomer Mortality Experience: Welcome to Old Age! 2020-2021 U.S. Mortality Increase for Ages 60-79 was Mostly COVID
Old Seniors — Age 80+: mainly Silent Generation (as older generations are mostly dead at this point) – Silent Generation Has Odd 2021: COVID Over 100% of 2021 Mortality Increase Compared to 2019 in the U.S. for those over age 85
Enjoy!


Share this post