Millennial Massacre Part 2: Increase In Mortality for Ages 18-39 for 2020-2021 Mainly Driven by Drug Overdoses and COVID
Mainly Drug ODs, actually. COVID came in second for most of it.
Since my last post on young adult mortality through the pandemic, the CDC has done a data update, and I have fairly good 2021 data for cause of death. Also, I have decided on an approach for dealing with excess mortality and cause of death.
Scroll down to the very end of the post for the very nit-picky nerdy details. The simple version is that I will take my usual approach: I am comparing everything against 2019, as 2019 was a fairly quiet year, and I don’t want to do anything complicated like continuing pre-pandemic trends for comparison (not for the blog, at any rate.)
Here are my top-level results:
About 30% of the contribution to excess mortality for young adults in 2021 came from drug overdoses.
The percentage contribution to excess mortality of drug ODs was not that different by age group over the 18-39 age span.
COVID as a contribution to excess mortality was higher for older people —- for those age 35-39, 36% of their excess mortality came from COVID in 2021. In contrast, for those age 18-24, only 17% of their excess mortality came from COVID.
Indeed, the youngest of the adults (age 18-24) had higher contributions from homicide (20% of excess mortality) and had comparable excess mortality contribution from motor vehicle accidents (16%) in 2021.
Below I will share graphs from each age group and some observations for each age group.
Age 18 – 24
Longer trend, 1999-2021
For all of these analyses, please pay close attention to the scale of rates. On this graph, the total mortality for 2021 is just over 100 per 100,000. If you simplify that to percentages, that’s just over 0.1% per year.
Note that at the beginning — in 1999 — the total mortality rate was about 90, which then reached a low point in the high 70s in the 2010s. It started climbing thereafter.
In my prior post, I had a large category called “accidents”, but you don’t see that now, because I found it obscured two meaningful trends: motor vehicle accidents and drug overdoses. Now that I’ve broken them out, it is very clear that drug ODs have been a driving force in the recent increasing mortality for this age group.
The way this graph is set up, it is difficult to see what exactly drove the large step up in mortality in 2020 and 2021, but that’s okay. The point of this graph is to give you the long-term trend, and the general “weight” of the various causes of death. You can see that drug ODs used to be a very small portion of the mortality, and now it is much larger, with a large step up in 2020.
In addition, motor vehicle accidents used to be a much larger portion; now it is smaller.
Let’s focus just on the pandemic years.
Attribution of increase in mortality, 2020-2021
I will be doing this analysis for each age group. There will be a table at the end with the percentage breakout for each age group, but for now, let the contributions be the actual numbers and be the visual weight.
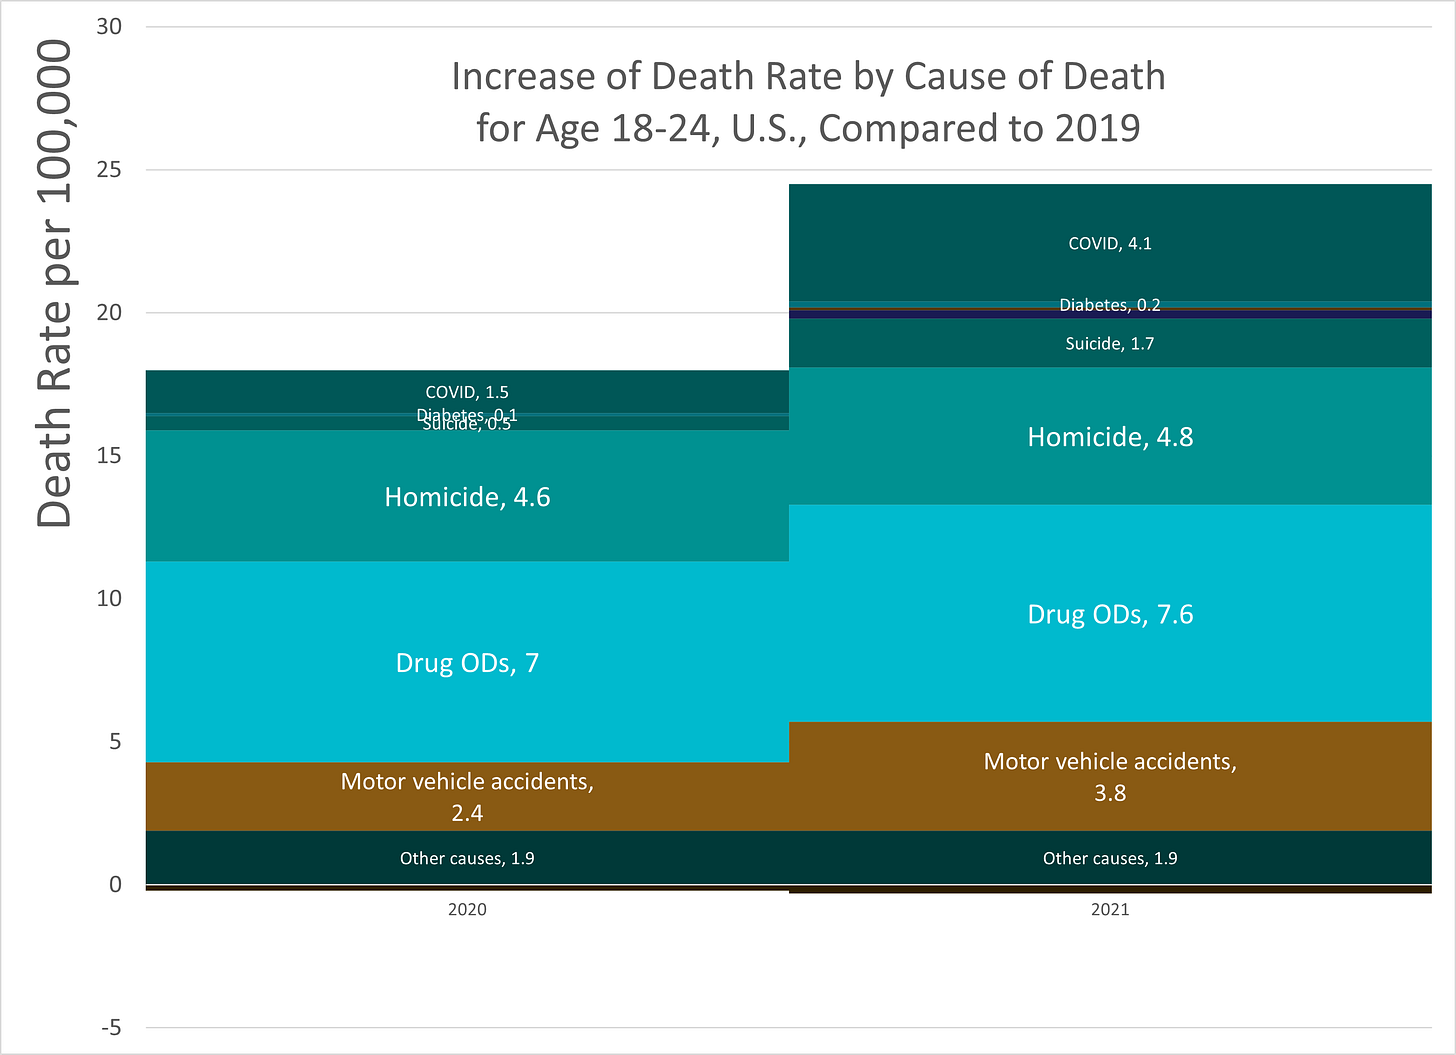
What you are seeing here are the rate increases (in per 100,000 per year amounts) by cause of death compared to 2019.
To make it concrete: in 2019, the rate of death for ages 18-24 from drug overdoses was 13.8 per 100,000. In 2021, it was 21.4. The difference is 7.6.
I did this for the top causes of death (as I broke them out), as well as the remainder (that’s the “other causes” catch-all category).
So you can see the total step up in mortality by year, and we can make an attribution by cause of death.
For this age group, drug overdoses were the largest contributor to the increase in mortality in both 2020 and 2021.
Homicide was the second largest.
COVID didn’t really make much of a contribution until 2021, and even then it came after drug ODs and homicide.
COVID is very age-loaded in its risk, with or without vaccinations.
By the way, both heart disease and cancer are in the analysis, except heart disease barely increased (from 2.4 per 100K in 2019 to 2.7 per 100K in 2021) and cancer decreased (from 3.5 per 100K in 2019 to 3.2 in 2021). The death rates from both heart disease and cancer are very low for this age group and account for on the order of 1,000 deaths total each per year. These are not large numbers.
Age 25 – 29
Longer trend, 1999-2021
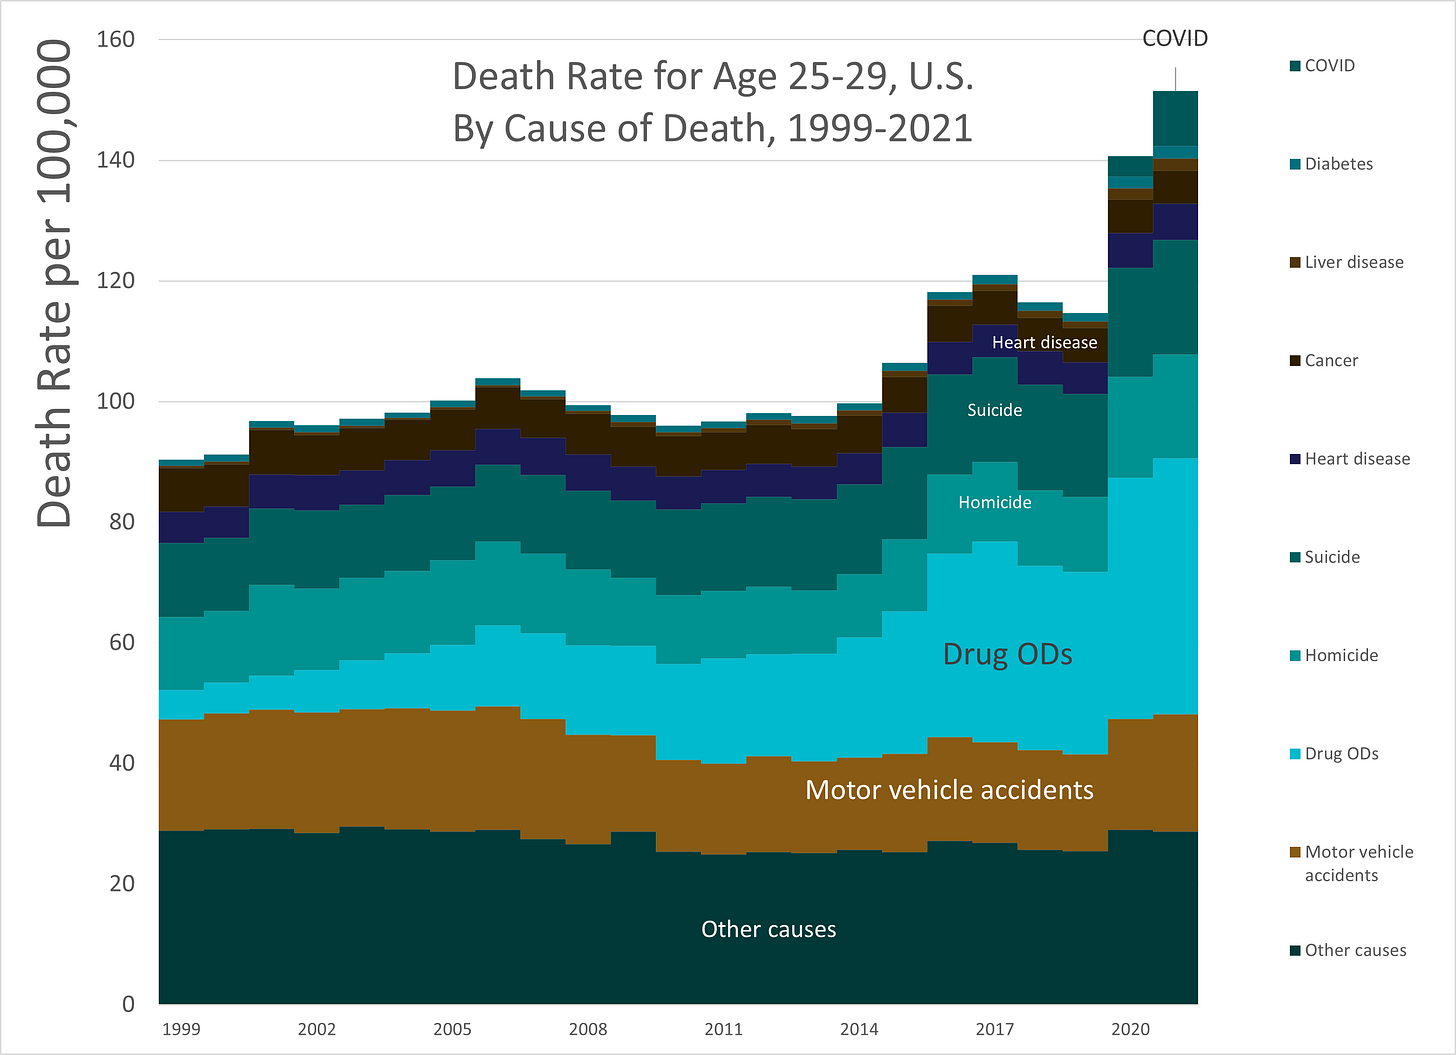
As we step into older age groups, drug ODs actually get worse. We’re already seeing it. The trend is much worse than the 18-24 group.
I’ll note that motor vehicle accidents start out a much more benign trend for this age group compared to the 18-24 age group. There is a reason that auto insurance rates drop once you reach age 25.
Total mortality starts climbing as well, and the natural causes of death like heart disease and cancer are higher. COVID takes a harder bite.
Attribution of increase in mortality, 2020-2021
Now things get to be a bit more interesting.
The effect of drug overdoses is still higher than that of COVID in both 2020 and 2021, but homicide is less.
Motor vehicle accident deaths were worse in 2021 than in 2020. Suicide was actually worse in 2021 and 2020.
Age 30 – 34
Longer trend, 1999-2021
As we get to older ages, I’m really starting to get depressed, because the drug overdose trend is horrific. It’s worst not in people in their 20s, but people in their 30s and 40s. The drug OD trend is dominating, and we see an appreciable suicide trend as well.
My lord, this is depressing.
This is as cancer and heart disease death rates are growing with growing age. And yet, these “external” causes of death grow.
Yes, homicide peaks in the 20s, as does motor vehicle deaths (till you get to old age) but having suicide and drug ODs at such high rates in age 30s and 40s is just harrowing.
But wait, it gets worse.
Attribution of increase in mortality, 2020-2021
So here is the hideous thing.
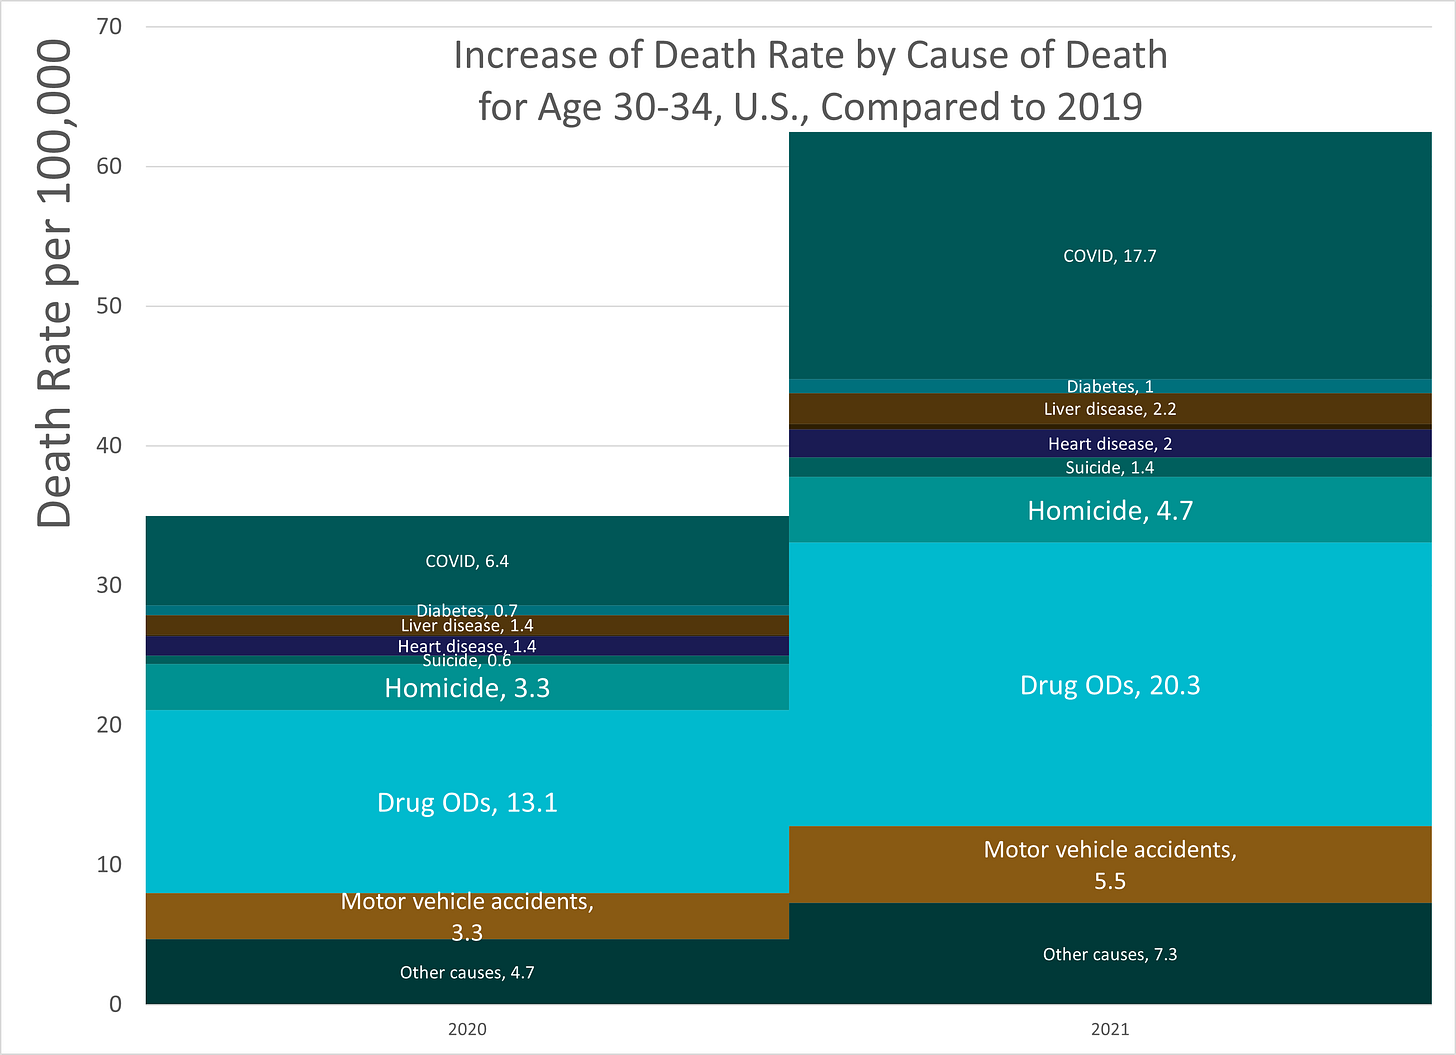
Drug OD attribution to excess mortality is STILL larger than COVID. COVID is approaching, as it grows with growing age.
But now we’re starting to see why there was so much excess mortality among people in their 30s and 40s — they were getting hit with a double-whammy: both drug ODs, which already hit this age group hard before the pandemic, and COVID, which hits harder at older ages.
Those in their teens and 20s are hardly affected by COVID, and while those in their 30s and 40s don’t die much from COVID (20 per 100,000 is only 0.02% after all), it still is substantial for people who aren’t dying of much in general. Remember that mortality naturally grows exponentially. People don’t really notice the bite until they hit that ski ramp past age 65. (Howdy, Boomers!)
Drug ODs and COVID are dominating everything else at this point. For ages 30-34, in the year 2021, those two together accounted for 61% of the increased mortality.
Age 35 – 39
Longer trend, 1999-2021
Finally, the last group for this post.
Now that we’re getting into middle age, the natural causes like heart disease and cancer are taking up more space on the graph. Drug overdoses still have a bad trend. Motor vehicle accidents are a small slice, barely an impact.
COVID takes up a bigger range in 2021 than we saw in prior graphs.
Suicide is still pretty substantial.
Attribution of increase in mortality, 2020-2021
In 2020, drug ODs were more substantial in contributing to mortality. In 2021, COVID was the primary contributor to increased mortality.
But note how much worse drug overdoses were in 2021 than in 2020.
I will also note that liver disease with a 4.9 contribution in 2021 was worse than in 2020.
This age group, age 35-39, is the first of the age groups, and it was in 2021, when COVID had a larger effect on mortality than drug overdoses did.
For all other age groups (and this includes children, given my prior analyses), other things had larger effects. For ages 18-24, the primary driver of increased mortality was drug overdoses for both 2020 and 2021.
Summary tables of contribution to excess mortality
For 2020
In the first column, I’m indicating how much mortality increased compared to 2019. So for the age 25-29 years group, their mortality increased 23% from 2019 to 2020, increasing from 114.7 per 100K to 140.7 per 100K (that's in the "Total Mortality in 2020" column), for an "Incremental rate change" of 26.0 per 100K.
Then it breaks out what percentage came from what cause. 37% of that increase for ages 25-29 came from drug overdoses. 17% came from homicide. 13% from COVID, etc. This comes from the analysis you see in the post above.
For 2021
As we can see, first, all these age groups had worse mortality in 2021 than in 2020, and it was much worse for the older age groups than the younger age groups.
In general, COVID contributed more to increased mortality for the older age groups (as expected).
Homicide and motor vehicle accidents tended to contribute more increased mortality in younger age groups.
Drug overdoses were the primary contributor to increased mortality for ages 18-34, at about a third of the increased mortality.
Plan for older age groups
As noted in part one of this investigation, the plan of attack is this:
Young Adults — Age 18-39: approximately the Millennials in 2020-2021 — this post.
Middle Agers — Age 40-59: approximately Gen X
Young Seniors — Age 60-79: approximately Boomers
Old Seniors — Age 80+: mainly Silent Generation (as older generations are mostly dead at this point)
Given that I am now comfortable with the current data set, and that I like the approach I took in this post, I plan on taking similar approaches in future posts. I will take them in order, so Gen X (yay, us!) is next.
The difference is that you will be seeing different causes of death in the breakout for attribution for causes of excess mortality. Cancer and heart disease will be more prominent in the next group, but unfortunately, drug overdoses will still be prominent. The causes of death for the Middle Agers will likely be the same as the ones we’re seeing here.
For the seniors’ posts, different causes of death will be more important, such as falls. These are usually not broken out separately in accidental causes of death, but I want to do that so that you can see significant causes of death. I needed to break out drug overdoses and motor vehicle accidents here, because they had very significant trends for young adults.
Methodology
Data for deaths in 1999-2020 had been taken from the CDC WONDER Online Database for Underlying Cause of Death, finalized data. Citation: Centers for Disease Control and Prevention, National Center for Health Statistics. National Vital Statistics System, Mortality 1999-2020 on CDC WONDER Online Database, released in 2021. Data are from the Multiple Cause of Death Files, 1999-2020, as compiled from data provided by the 57 vital statistics jurisdictions through the Vital Statistics Cooperative Program. Accessed at http://wonder.cdc.gov/ucd-icd10.html on Jun 20, 2022.
Data for deaths in 2021 had been taken from the CDC WONDER Online Database for provisional mortality data. Citation: Centers for Disease Control and Prevention, National Center for Health Statistics. National Vital Statistics System, Provisional Mortality on CDC WONDER Online Database. Data are from the final Multiple Cause of Death Files, 2018-2020, and from provisional data for years 2021-2022, as compiled from data provided by the 57 vital statistics jurisdictions through the Vital Statistics Cooperative Program. Accessed at http://wonder.cdc.gov/mcd-icd10-provisional.html on Jul 22, 2022.
For the cause of death, the ICD-10 113 Cause List had been used, and specific causes of death were used for their significance for these specific age groups. If this is on substack, you can download the accompanying spreadsheet to see the specific cause of death codes from the list of 113, and that they were non-overlapping. There was a catch-all “other causes” category used.
To measure “excess mortality” or increase in mortality, a comparison against the year 2019 was used.
In all cases, crude death rates (based on population estimates provided in CDC WONDER) are used as provided by the CDC, using the standard rate per 100,000 people per year.
It is to be noted that some of the causes of death showed a decrease in rate in 2020 and 2021 compared to 2019 (most notably, cancer), though these were not large decreases. There was no adjustment made to consider that some adjustments were negative. It was not considered material.


