Top Causes of Death in U.S. for 2021 by Age Group
Ranking tables by death counts and by rates
Yesterday, CDC updated the provisional 2021 database of death data on WONDER, and there was no longer censored data for 2021.
Huzzah!
There may still be some small details that get changed before the CDC adds 2021 to the finalized death data set, as there does require review and data cleaning before finalization. Even before COVID, we wouldn’t get finalized data until December, usually.
I did a post two months ago when the totals overall were fairly stable, and no, there are no great surprises. The results are essentially the same now as they were two months ago, in a material way.
That said, now that the data are fairly settled, and I don’t have to worry about unclassified deaths (are those censored deaths homicides, suicides, drug ODs, or something else?), I will be revisiting some of my more recent “nasties” to see what we may be able to find in more detail. In the interim, let’s look at our ranking tables.
Top causes of death by age group for 2021
There will be two tables, and I’m using the standard 10-year age groups from CDC WONDER.
First, we will look at the total number of deaths by cause and age group.
Note that I’ve used my own idiosyncratic coloring of significant causes of death. Obviously, I wanted COVID to stand out, and it was an official top underlying cause of death for the age group 45 – 54 years old.
I will embed the ranking table for 2020 below, as well as 2019, so you can compare.
The main issue with the rankings is that rankings are discrete, but there can be huge gaps or small gaps between two causes of death that are adjacent in this ranking table. That is true for a single age group as you go up and down — for age group 45 – 54 years old, COVID, heart disease, and cancer are all about the same order of magnitude. But in the adjacent age group 35 – 44 years old, going from accidents to COVID, the number of deaths halves.
And then, obviously, when you go from column to column, the number of deaths involved changes greatly. When you start with children, the number of deaths for a cause might be a few dozen or hundreds. But at old ages, you’re talking hundreds of thousands for a single square.
That’s quite a difference.
Death rates by age groups and cause for 2021
Here is the same table, but now as death rates.
Usually, when we talk about death rates, we standardize by showing them in rates per 100,000 people for a year.
That’s because death rates, especially for a given cause of death in a single year, tend to be very small unless one is very old.
However, most people can’t really think about these numbers very well.
I like doing them with percentages, especially with the leading zeroes. Then people often notice just how small these numbers are.
(Yes, some of them are showing as zeroes, because I couldn’t be bothered to keep extending the digits. These are very small rates.)
Or, in the case of death rates for the old, these death rates are actually quite large. Or perhaps, if you’re being intellectually humble and not in my field, that maybe you don’t have a very good idea of what a high death rate actually is.
Yes, a 1% death rate in one year is actually quite high. In case you didn’t know.
Comparison tables — 2019 and 2020
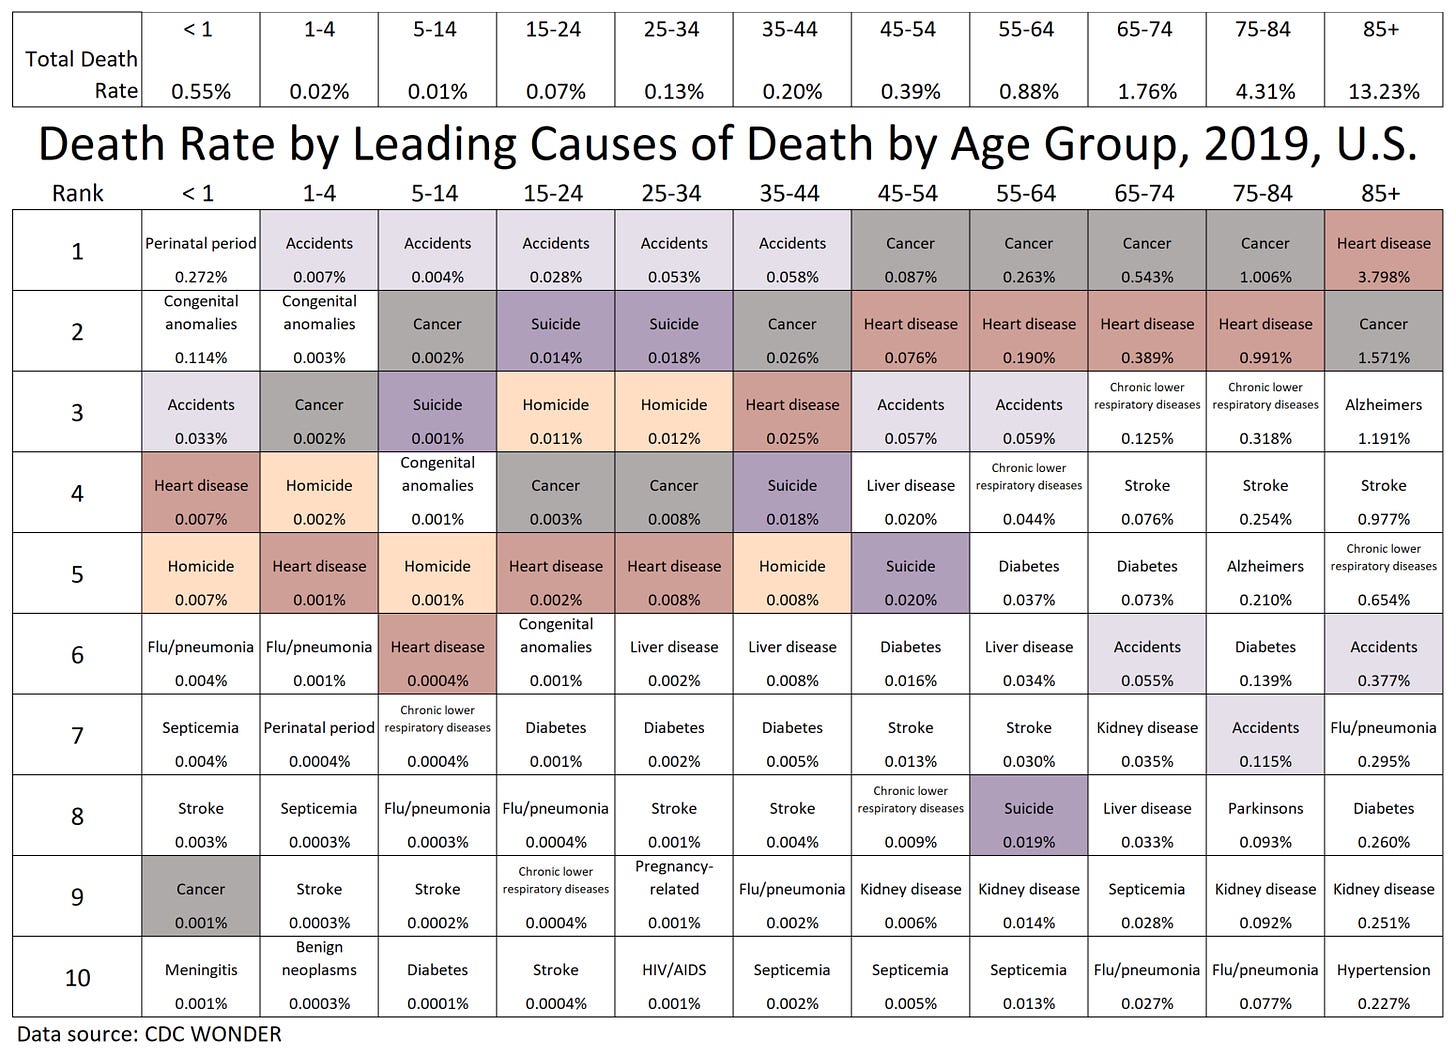
Here are the rate tables for 2019 and 2020. I’m going to keep it to rates, though the spreadsheets I will embed on the substack post will have the death count version as well.
2020:
2019:
If you’re on substack, there will be two spreadsheets below, one with the 2019 and 2020 finalized data, and one with the 2021 provisional data, and you can compare the three sets of results to your heart’s content.
One thing you can see right away from the tables is that the COVID death rates got worse for adults under age 65, and got better for adults over age 65.
That said, it doesn’t really matter that the COVID death rates fell for seniors, given that their total death rates from all causes remained elevated in 2021, compared to 2019. Only the age group 85+ saw a decrease in total death rates for the adult ages, while all the rest saw death rates continue to increase.
As I’ve said in other contexts, dead is dead. If more seniors aged 65-84 are dying from cancer instead of COVID, not sure if that really counts as a win.


Last two posts have been great, thanks for pulling all this data together. I really hate the layout of Wonder so getting the data pre-pulled into XLS is great, thanks!
Are you interested in running some excess death breakdowns by age group and considering (where possible) what % they are attributed to cause? Would make an interesting post.