Alternative Assets in Public Pensions: 2001-2022 update
Redoing the January 2024 graph and ranking table
In light of yesterday’s podcast, in which I discussed current drama at the Ohio Teachers pension plan, I commented on the asset allocation and complaints about bonuses paid to the investment staff of the pension plan. As far as I can tell, there’s nothing particularly out-of-the-way in how Ohio Teachers allocates its assets, and we shall see that concerning its allocation to alternative assets it sits exactly in the middle.
Public Plans Allocation to Alternative Assets
I will link to older posts on this subject at the end of this, but let me be clear about what is considered “alternative” assets … actually, it would be easier to indicate what is not considered alternative first:
publicly-traded equities
publicly-traded bonds and similar fixed-income securities
cash
That’s it for “core”, traditional investments.
My data come from the Public Plans Database, and I grabbed it today.
The types of assets considered “alternative”:
private equity
real estate
hedge funds
commodities
assorted alternatives/other
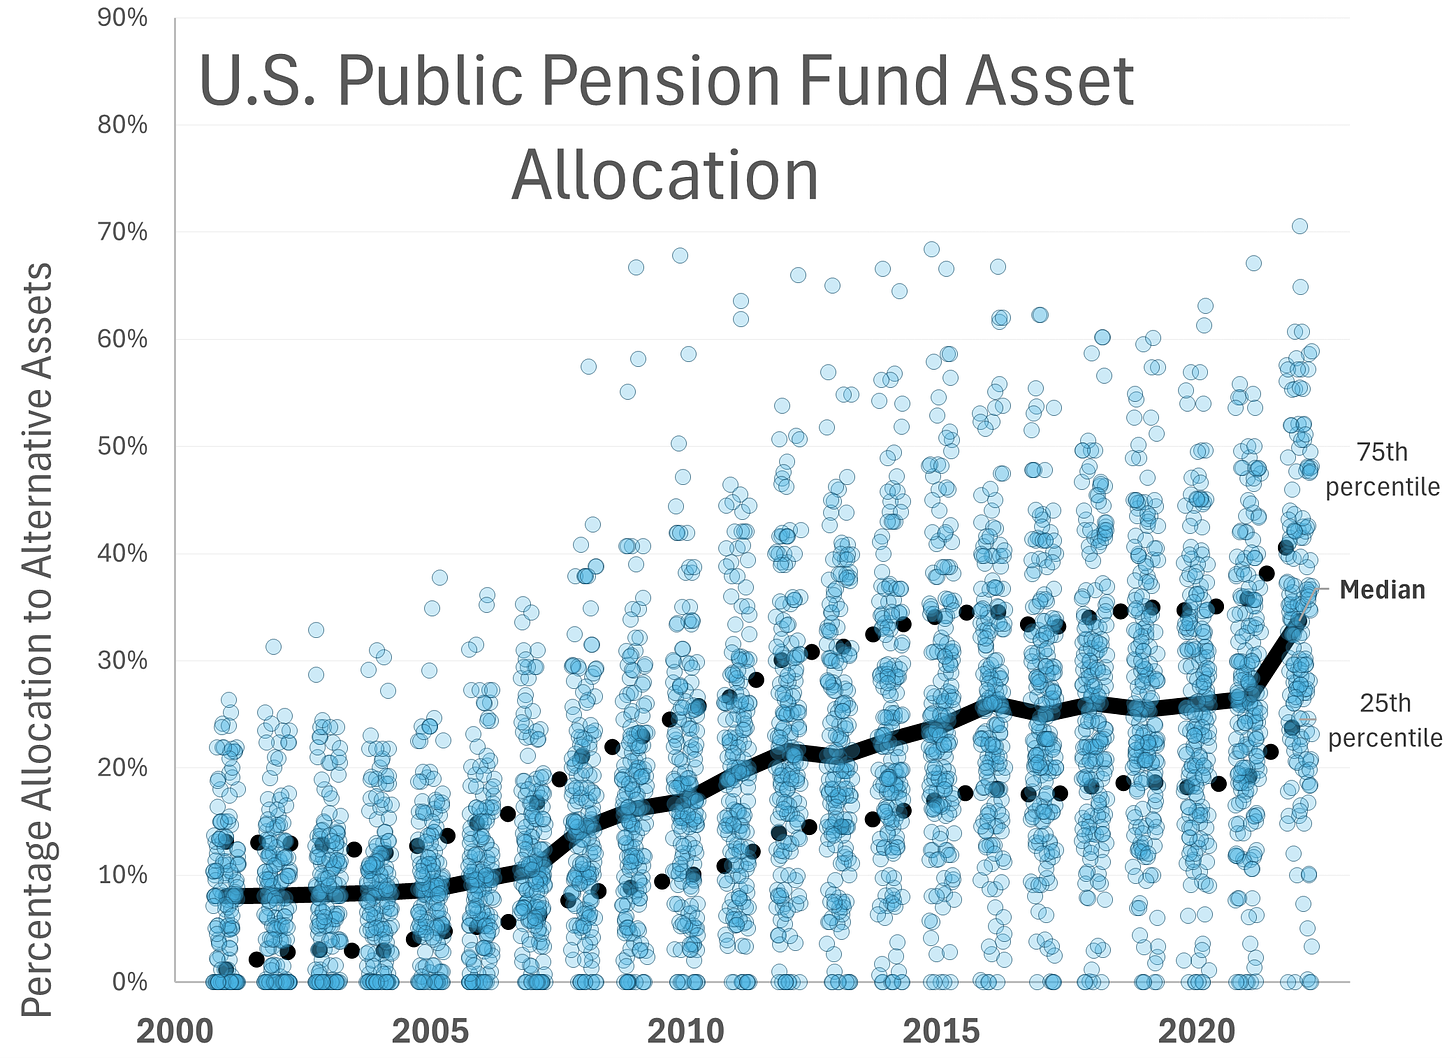
Here is how the data have evolved for all the available plans, fiscal years 2001 - 2022:
I had done this graph back in January, but I realized I made an error in that earlier graph. It’s going to be difficult to tell the error by eye-balling… it’s that some of the plans were missing data, and when I had originally pulled the data, I had the lookups return zeroes instead of “no data”. That’s my own fault.
My fault, my most grievous fault
So I was over-counting zeros. In over-counting zeros, which would be difficult to see with data points, that pulled down the percentile lines — the 25th, median, and 75th percentile lines were too low for the data sets I had.
HOWEVER.
This may also point out that some of the plans missing such allocation data may be biased in certain directions. It may very well be the situation that those less likely to report on their asset allocations are such that they’re extremely boring allocations…
….or maybe excitingly risky allocations… who knows?
In any case, the zeros plotted above are mostly real zeros (I found a couple zeros I thought bogus, but they are as reported in the database, and I’m not investigating further right now.)
Top 20 Plans with Allocations to Alternative Asset Classes in FY 2022
Everybody loves a ranking table:
In a few of these cases, obviously the plans have exactly the same allocations because they’re sharing investment strategies, perhaps as with Maryland PERS and Maryland Teachers.
All of these top-ranked plans in terms of alternative allocations have had increasing allocations in the last 5 years, more or less. But these are only the top 20, and only the last 5 years.
Some movement comes from the market value of traditional asset classes losing value, but even so, some plans (not many, but some among the 183 I have in this ranking table), have no allocations to alternatives.
Let’s look at the bottom of the list:
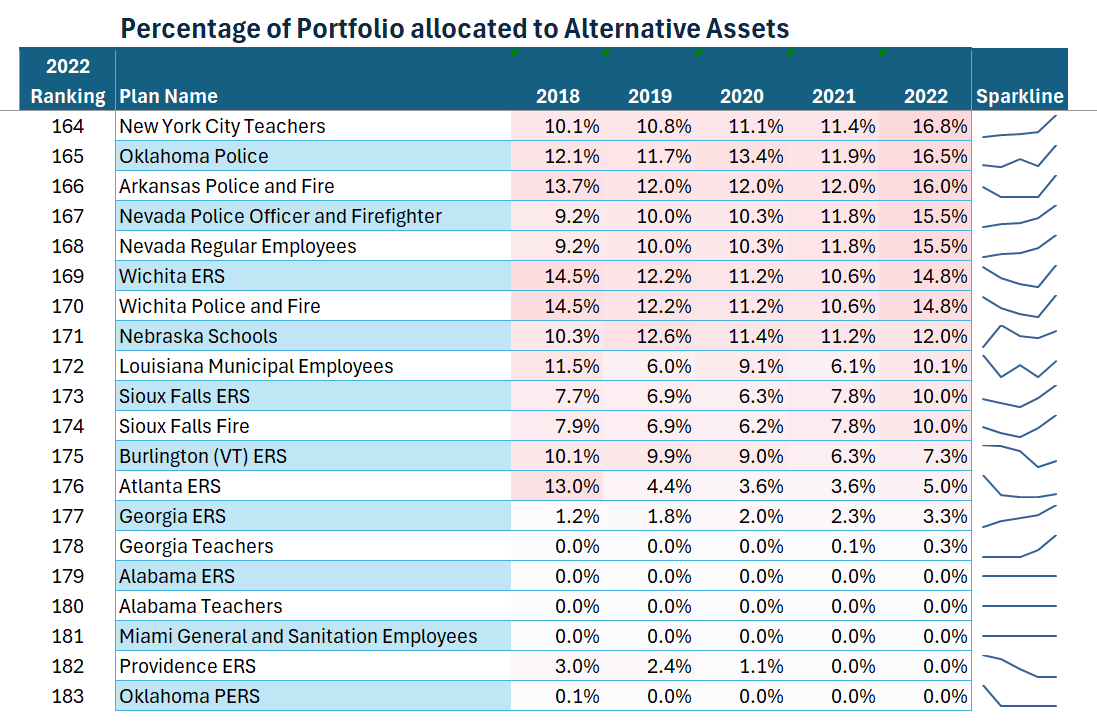
Bottom 20 Plans with Allocations to Alternative Asset Classes in FY 2022
You can see that at the other end of the list, you have a mix of plans with rising, level, and falling allocations to alternatives.
You may wonder where Ohio Teachers falls:
It’s sitting smack dab at the median for 2022, which was 33.7%.
I would argue that the median is over a third of the portfolio is concerning… but we shall see how that works out.
Spreadsheet
Related Posts
January 2024: Alternative Assets in Public Pensions: January 2024 Update
May 2023: Choices Have Consequences: Public Pension Investments in Alternative Assets
May 2021: Which Public Pension Funds Have the Highest Holdings of Alternative Assets? 2021 Edition
2018: Alternative Assets and Pension Performance: A Dive into Data
2017: Which Public Pension Funds Have the Highest Holdings of Alternative Assets? Has It Paid Off?
2014: Public Pensions Watch: Don’t Go Chasing Waterfalls….or Alternative Asset Classes, pt 1 of many
August 2014: Public Pensions Watch: Dallas Pension Learns About Concentration Risk
September 2014: Public Pensions and Alternative Assets: Dallas Shows How It Can End
2017: Public Pension Assets: Our Funds were in Alternatives, and All We Got Were These Lousy High Fees
2015: Reddit-Public Pension Connection: Alternative Assets and Risk
2014: Public Pensions Watch: More Reactions to Calpers Pulling Out of Hedge Funds
2014: Public Pensions Watch: Alternative Assets, pt 8 of many — New Jersey followup


Are the changes in alternative assets correlated to a measure of pension fund health? For example, if a plan is underfunded, is it more or less likely to invest in alternatives? Is there a lag or a leading indicator? (First buy alternatives, funding levels fall, buy more? Or funding levels fall, then try to make up for it by buying alternatives?