In the last Taxing Tuesday, I gave my effective tax rate for Federal personal income tax. Somebody asked me how I was able to keep it so low, and the answer is that I am the sole wage earner in a family of five. The rate will be climbing as my children, one-by-one, age over 18… but they’re all still dependent on my wages.
(Oh, and my income has been actually going down the last 5 years, but that’s a separate story)
But wait, there’s more!
That’s only a small slice of the Meep tax burden, of course.
Taxing Meep
Sales Taxes
Let’s ignore all the sales taxes I have to pay — I live in Westchester County, which has an all-in sales tax of 8.375%. I often shop in Putnam County, which has the same rate. Then there’s Danbury, CT, where we often shop, and its sales tax is 6.35%. So that’s the consumption tax after my income has been taxed.
But we’re just throwing all those taxes out. Poof. Gone.
Property Taxes
I only own one house, but I get taxed on it by the local town and by Westchester County.
The bill has run from $11,000 - $13,000 per year (it varies) for the last decade.
Payroll Taxes
Up until recently, I’ve been over the Social Security Wage Cap, but what with inflation (and as noted above, my income actually decreasing, not increasing), I’m not sure this will persist. So yeah, since about 2008 or so, I’ve been paying the max for the Social Security portion of FICA. In 2022, that was $147,000, and so 6.2% of that is $9,114.
Medicare tax has no cap, and that’s just a 1.45% tax on income.
I’m not going to include the employer portion of FICA.
State Income Taxes
This one is a pain in the ass, because I work for a CT-based employer, and when I do my side hustles, they’re based out of NY (not that I’ve made much money there lately). Given these are state income taxes, these are relatively simple… and it comes out to about half of my Federal income tax burden.
Grand Total of Income + Payroll + Property Taxes 2022 = 30% of Income
When I add in all the pieces, (and I’m ignoring sales tax), the rough amount is about 30% of my income.
Yes, this is after child tax breaks, etc., and me optimizing tax stuff out the wazoo.
Yes, this is me deciding to live in one of the highest-tax areas in the United States. I affirm this is my own fault.
I am setting the stage for the next bit, which is President Biden’s “plan” to increase taxes to improve solvency for Medicare, Social Security and let’s just see how much more the “rich” will pony out. Especially after bailing out their special banks.
The Plan: Tax More to Spend More
I will give him this: it is consistent with stated goals.
Whether it will achieve those goals (and it’s not going to get passed with the current Congress, that’s for sure - it wouldn’t even get through the Senate, even if it could originate this plan, which it can’t), that’s a question.
Let’s look at the proposal:
Tax Foundation: Biden’s FY 2024 Budget Would Result in More Than $4.5 Trillion in Gross Tax Increases
President Biden’s Fiscal Year 2024 Budget outlines several major tax increases that would bring U.S. tax rates far out of step with international norms. Some of the proposals may be familiar, recycled from prior budgets and failed legislative attempts, but some are new, like the proposed tax hikes for Medicare funding.
In total, they would add up to almost $4.7 trillion in new taxes targeted at businesses and high-income individuals. The major changes include higher marginal tax rates on corporate, individual, and capital gains income; a complicated new minimum tax on high-net-worth individuals; and increases to Medicare taxes. The negative effects of higher tax rates on saving, investment, and entrepreneurship would have economy-wide repercussions, ultimately harming workers, international competitiveness, and domestic investment.
Okay, $4.5 Trillion in new taxes ain’t chump change.
The Tax Foundation has a whole table of changes, but here is a simplified breakout of the net changes — projected over 10 years:
Corporate and International Tax Proposals: $2.9 trillion (projected over 10 years)
Individual and Pass-Through Business Tax Proposals: $800 billion
Capital Gains, Estate, and Gift Tax, and IRS Proposals: $355 billion
That’s a net increase of $4.7 trillion — over 10 years.
There are proposed $900 billion in tax credits/cuts, over the same period, so the net revenue result would be $3.8 trillion.
But that’s just looking at the changes out of context of what we started with.
Actual Proposal and Projections
Pushing past the sales job from the Biden Administration, let’s find the actual projections. I came across the Analytical Perspectives document and I thought “that’s an awful lot of words for something that should be mostly numbers.” And, of course, what’s annoying is that link is going to be pointing to a different document every year.
But what won’t be pointing to something different is the spreadsheet at the very bottom of the page (currently) — the spreadsheet titled Long Range Budget Projections for the FY 2024 Budget (Excel).
I will provide you with two items: Budget Baseline (which is what they started with) and Budget Policy (which is the proposed changes).
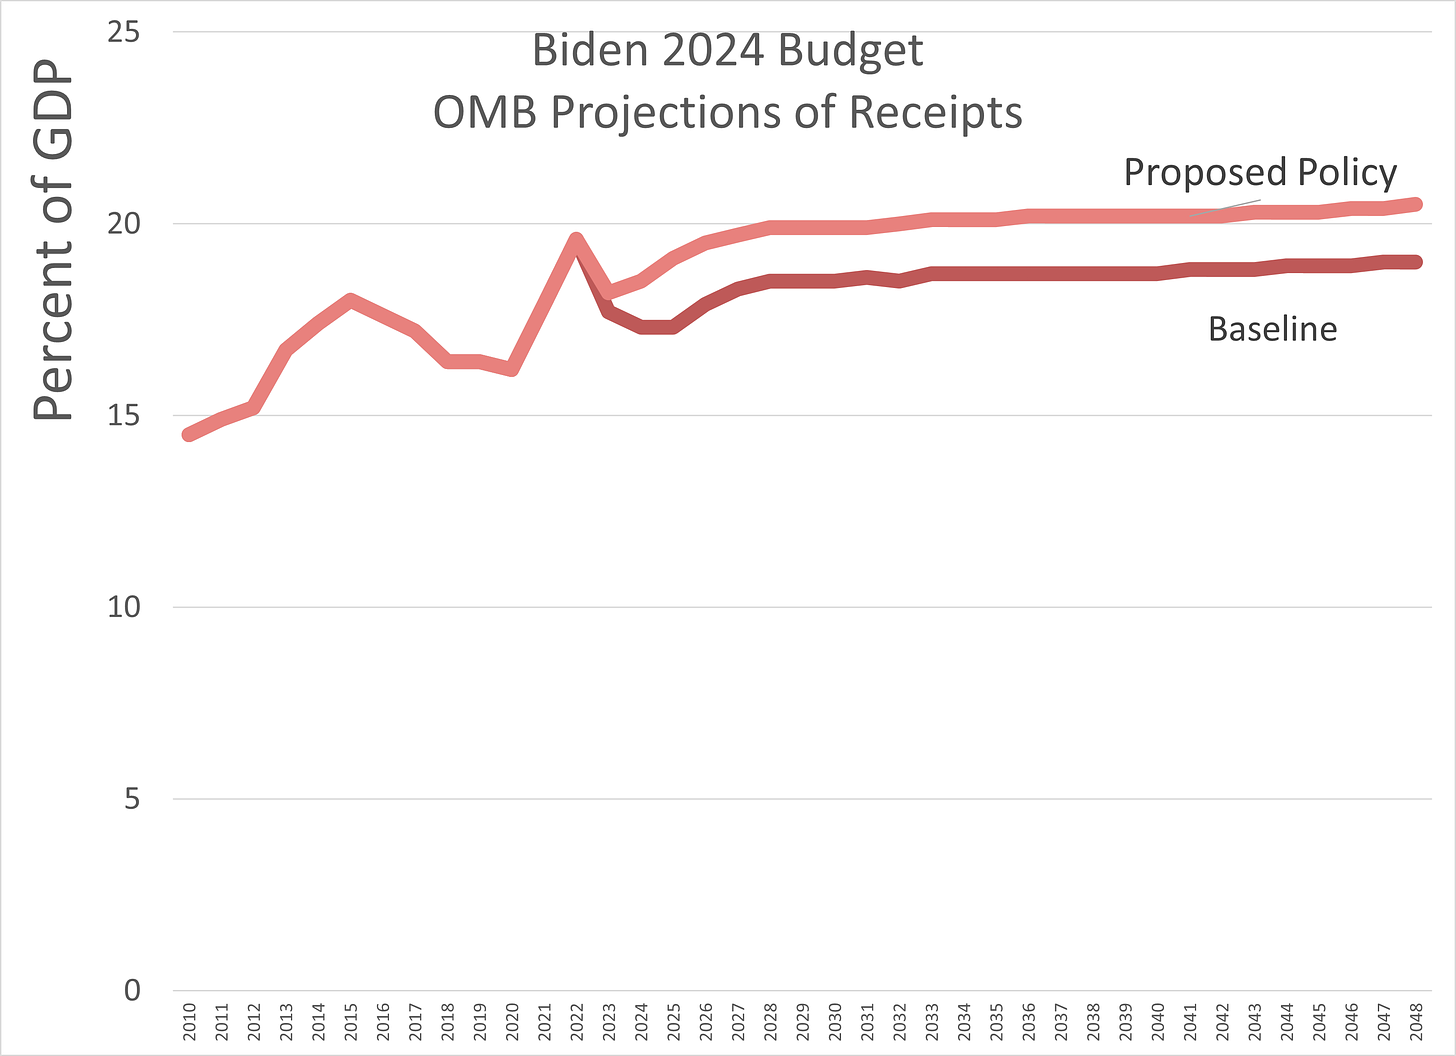
First, just the totals revenues as lines:
So, none of this namby-pamby tapering in, no sir. Just straight into a tax increase. It’s about an 8% - 10% increase in taxes.
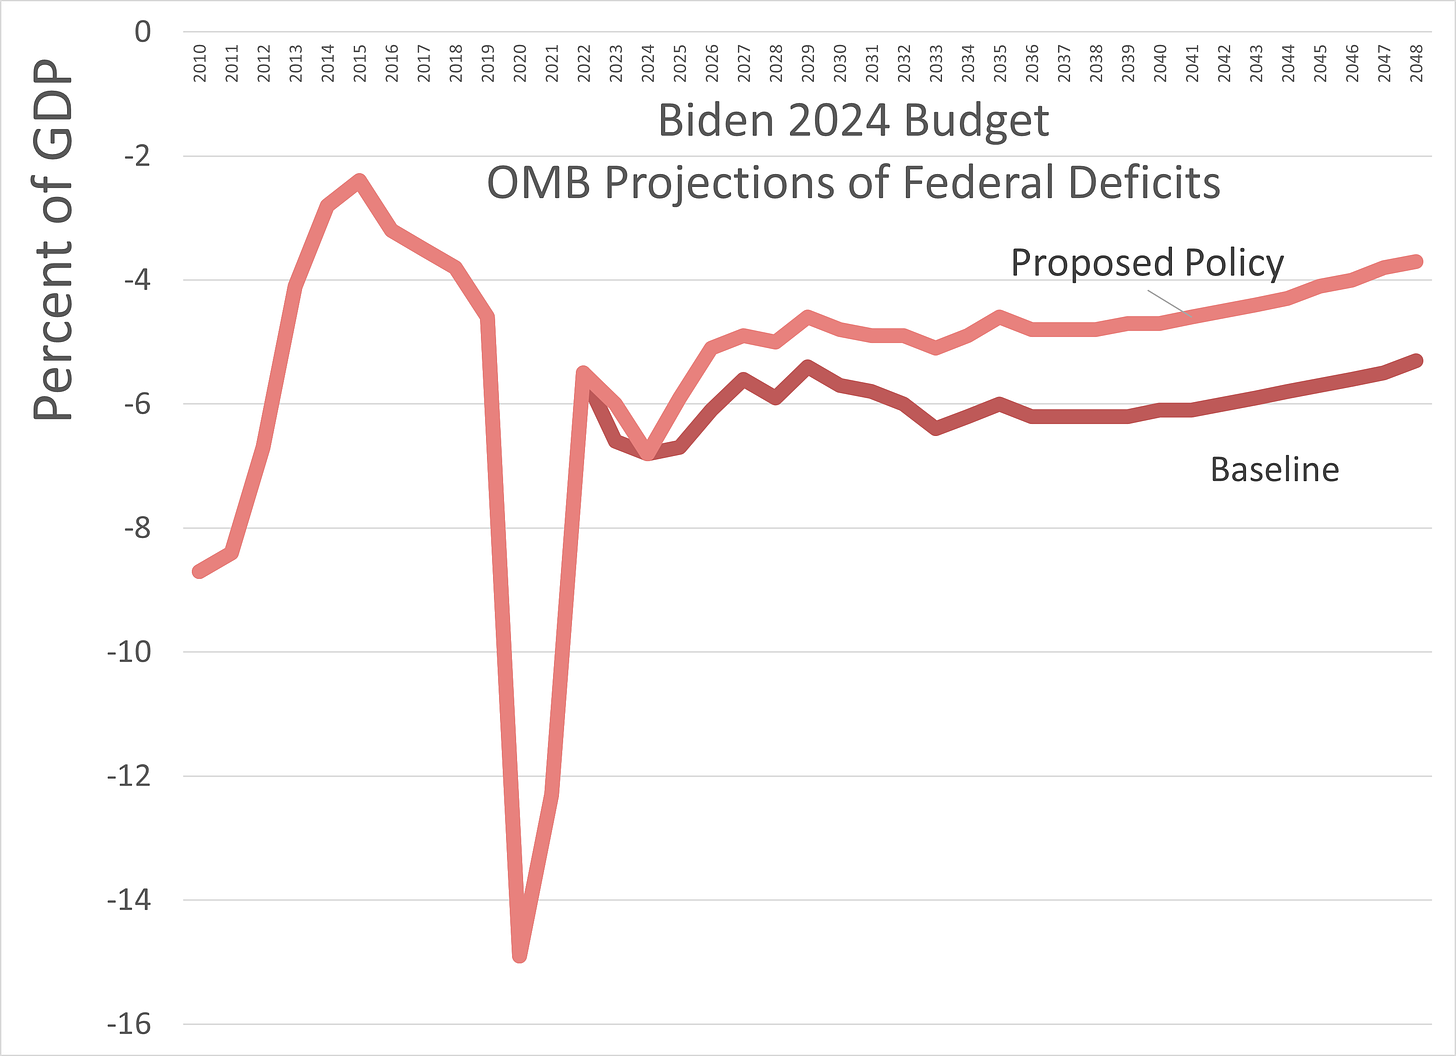
So, let’s see how the deficit runs (and I’m using their baseline assumptions on this… which may be keeping interest rates on the debt down) between the two scenarios:
In this case, you’re seeing negative numbers, and a more into the negative is a worse thing.
Unsurprisingly, higher revenues with not much extra spending (as projected), leads to smaller deficits… but still perpetual deficits.
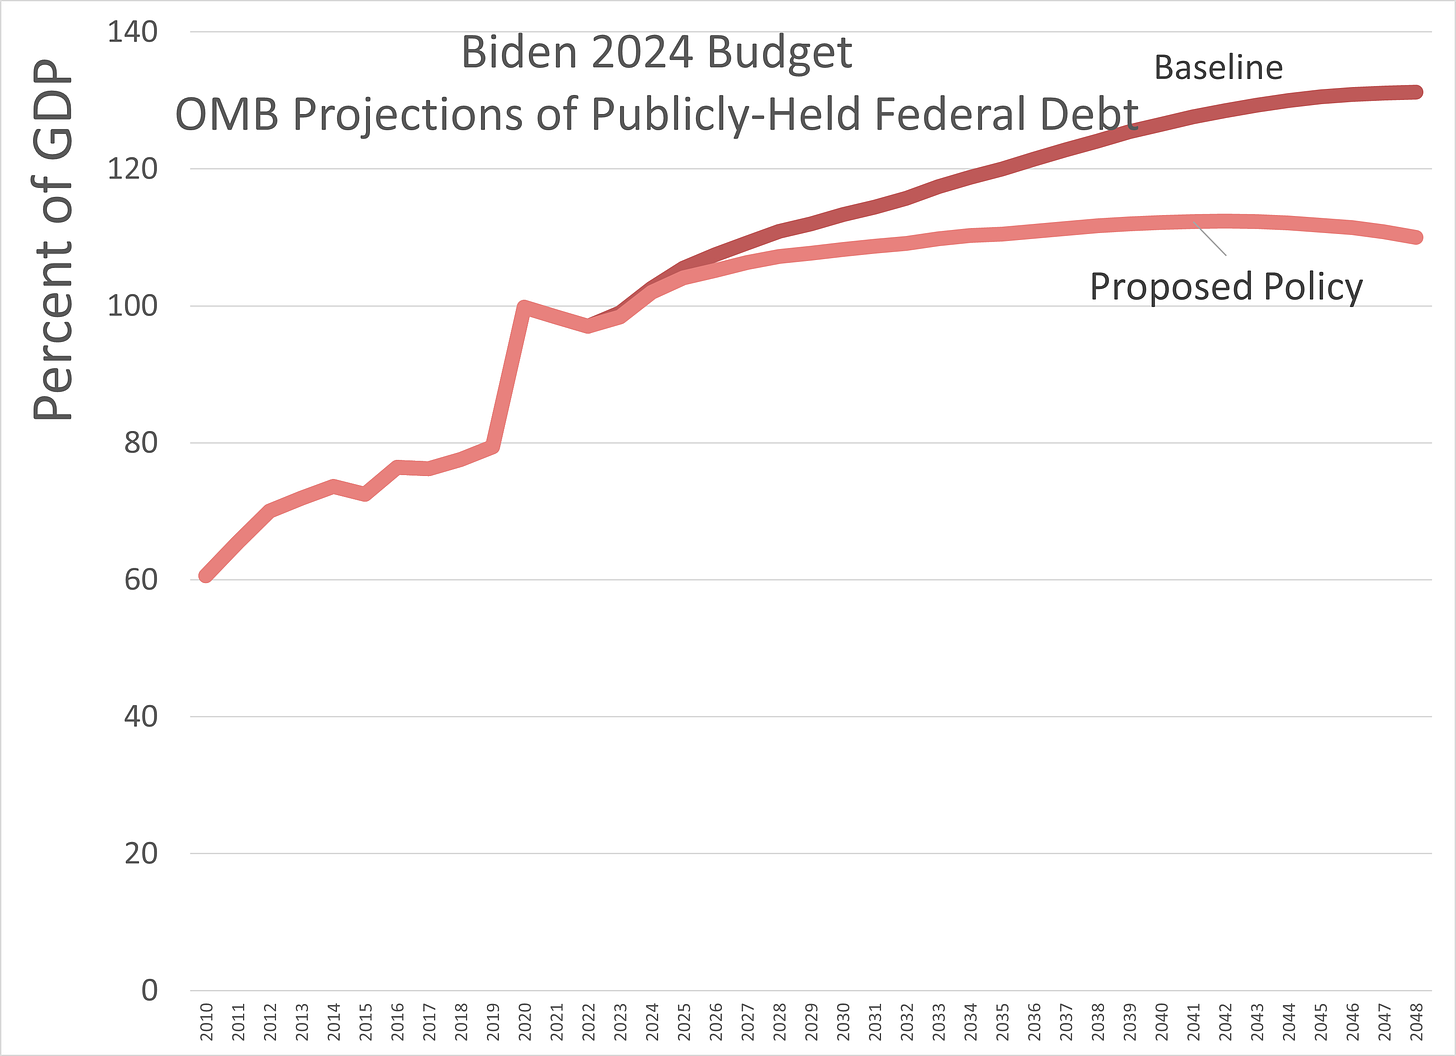
Let’s see what that does to the debt:
So the debt grows in relation to the GDP, just more slowly.
At least it’s “just” higher taxes and not a bunch more larded-on spending. Yet.
The essential problem: spending baked in
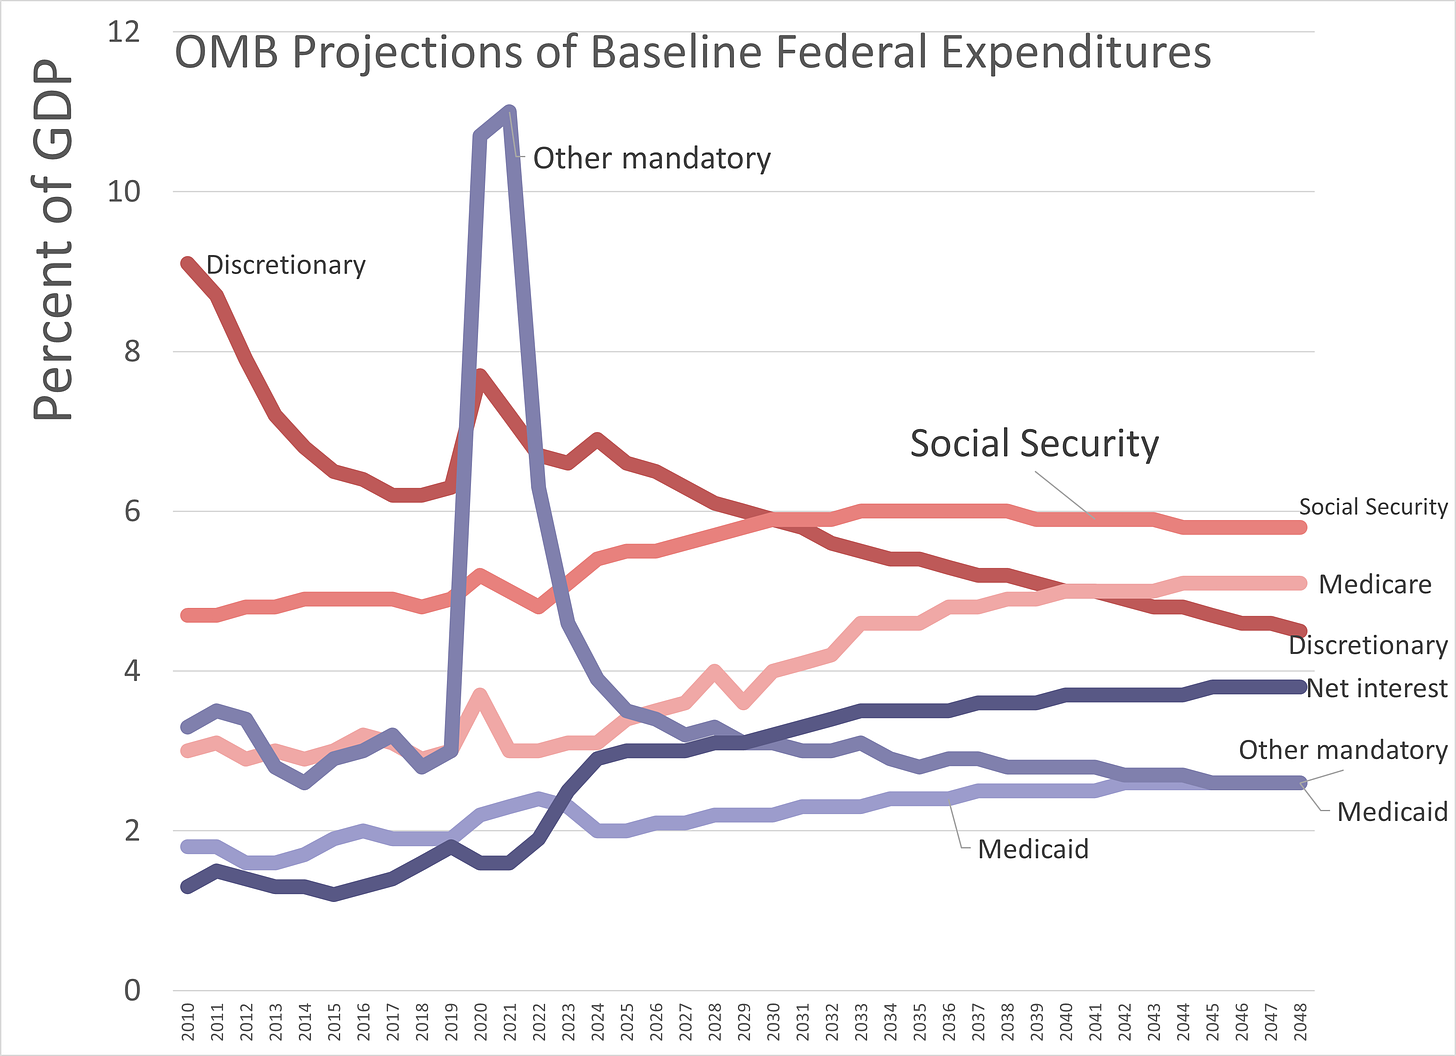
So, these are just an opening bid for this year, just nibbling at what is the problem:
I wanted to change the terminology in this graph of “mandatory” and “discretionary” spending.
It’s all essentially discretionary.
But I want you to look at three curves in particular, knowing that there are loads of assumptions going into these projections.
There’s the “discretionary” curve. Which has been coming down down down.
Then Social Security and Medicare. Which are not going down.
Social Security surpasses the discretionary curve in 2032 (the year the Trust Fund runs out, hmm).
Medicare surpasses discretionary in 2042.
Now, looking at the actual history versus the smooth projected curves, we know that we will likely see something different from these projections. But they do give us an indication.
So this is just a “kick the can” approach.
I suppose it has worked for the U.S. thus far (and maybe we should look to Japan and see what its debt-to-GDP ratio looks like, and how much longer that will go on, especially as its country continues to record many more deaths than births).
That said, I doubt any of this will go anywhere, so we shall have to wait to see what actually happens.
UPDATE — Spreadsheet:


I assume the Social Security curve in the last graph is under current law (i.e. large cut in benefits when the trust fund runs out)?