Taxing Tuesday: Meep Files Her Taxes and How to Measure Tax Increases
Percentage Increases versus Percentage Points
It’s been a long day. At the butt crack of dawn, one of these “cute” tree rats was skittering across the curtain rods in the library adjoining my bedroom:
If you want the whole saga, you can read the short form on Twitter or the long form on Facebook.
Yes, the squirrel got released into the wild, unharmed, and meep just got her morning disrupted, that’s all.
Meep Files Her Income Taxes
But backing up to the weekend, I filed my federal and state (both New York and Connecticut) income taxes. Yes, Stuart’s, too, if you must know.
For tax year 2022, we had two minor children and one adult dependent, and for 2023, we will have two adults and one minor. Then 2024, they will all officially be adults. But likely, all still dependent.
But I thought you might like to see my effective federal income tax rate (noting that it excludes the payroll tax, which I will return to in a moment), going back to 2013:
Feb 2019: Meep Files Her Taxes


Here’s a graph of my effective tax rate:
In the greater scheme of things, there’s not much of a big narrative here. I suppose I could graph the actual dollar amounts, but it’s not going to have changed a huge amount, actually. My most volatile income years occurred before these years, actually.
Measuring Change in Taxes
In yesterday’s podcast, I was talking about the tax changes required to make Social Security and Medicare sustainable.
In particular, I made a point of changing Paul Krugman’s words of three percent of GDP to three percentage points of GDP, and you may wonder about the distinction. Aren’t they the same thing?
Well, no, especially when we’re talking about changes in taxes.
Before I get into this, I will drop an old video about math journalists should know.
That video was from January 2019.
One line from the video, starting at 2:52:
…but if you don’t understand that, say, increasing a property tax rate from 2% to 4% is not a 2 percent increase, it’s a 100% increase in the taxes… [other items elided]
…it’s very easy for those who do understand this to fool people
This comes up a lot in changing taxes.
In the January 2019 post in which I posted this video, Math Stupidity: Comparing Pizzas and What's Important, I pointed out the following:
THE MATH YOU REALLY NEED TO KNOW
There is the math you need to know as an individual.
- Taxes
- Interest rates on loans
- How savings compound over time, and what are realistic, and unrealistic, outcomes
- The trade-off between uncertainty in results and paying for insurance against those resultsTo be able to understand some of these, you mainly need to add, subtract, multiply, and divide, and understand what those mean.
And you really need to understand percentages.
….
THE MATH JOURNALISTS NEED TO KNOW
So, while few people are listening to me, more people are watching, reading, and listening to various news folks.
What math do the journalists really need to understand?
They need to understand:
- how basic statistics work: mean, median, mode, standard deviation, and sample sizes
- the difference between percentage increases and percentage point increases
- The distinction between rates and absolute amounts
- how to read a simple income statement and balance sheet (and what the differences are)
- how units work in general (like miles per hour, etc.)
I added emphasis to the original text.
Taxes are generally quoted in percentages as taxes themselves are percentages — percentages of income or sales or value.
But then they will increase that percentage from something to something else, and people get confused by the percentage increase that represents.
So let us work through the CBO projections for what is needed to cover “mandated” outlays as a percentage of GDP, and what that would represent in tax increases.
CBO Projections for Social Security
Here are the specific graphs you should look at:
CBO projections for Social Security
To make things simple for just the Social Security piece, we have revenues of 4.6% of GDP and outlays with scheduled GDP of 6.0% with outlays with scheduled benefits in 2032/2033 when the Trust Fund is projected to give out.
If you simply do a difference, you may think - ah, 6.0% - 4.6%, that’s only a 1.4% difference. Only 1.4% of GDP. That’s not too different. Not much of a hike to close the gap.
But the current taxation level is 4.6% of GDP, and you have to increase to 6.0%. That’s a 6.0/4.6 - 1 = 30% increase in taxation according to those specific numbers (they actually get to be more disparate later).
CBO Projections for 10 Years
That was just the CBO projection for Social Security to 2032/2033.
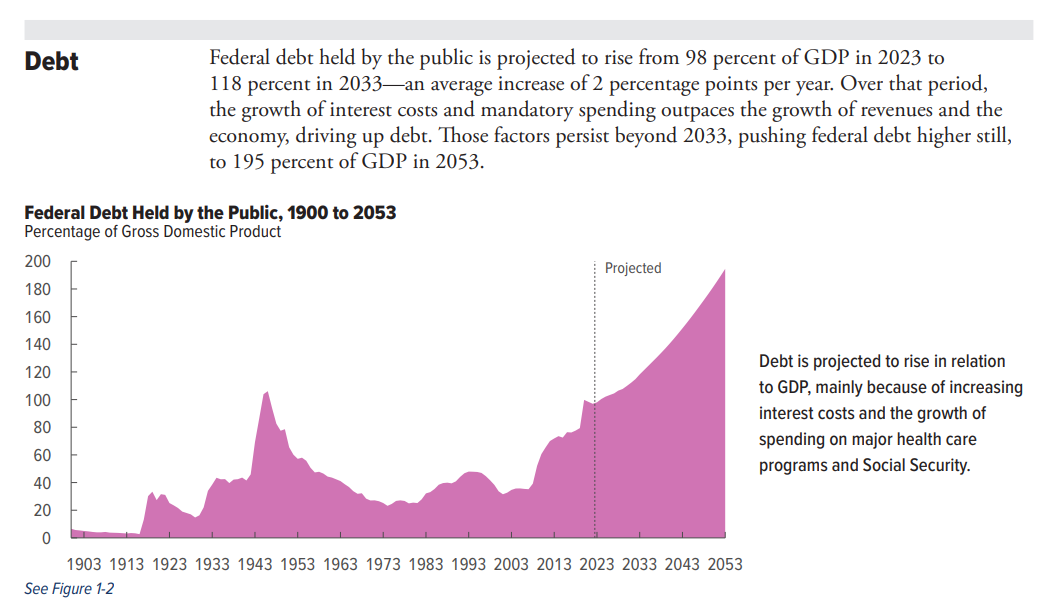
Let’s look at the CBO budget projection in general for the federal budget done this month.
If we wanted the revenues to match the outlays in 2033, that would be a 24.9/18.1-1 = 38% increase in taxes in 2033 over its baseline.
That’s just to close the gap in 2033.
That wouldn’t deal with the debt already accrued, of course.
Just a thought.
If you think that you can deal with the debt and deficit by only increasing taxes on the “2%”, ha ha ha.
Good luck with that.


