Summer Season Warning: Drowning Doesn't Look Like Drowning (Plus Drowning Mortality Trends)
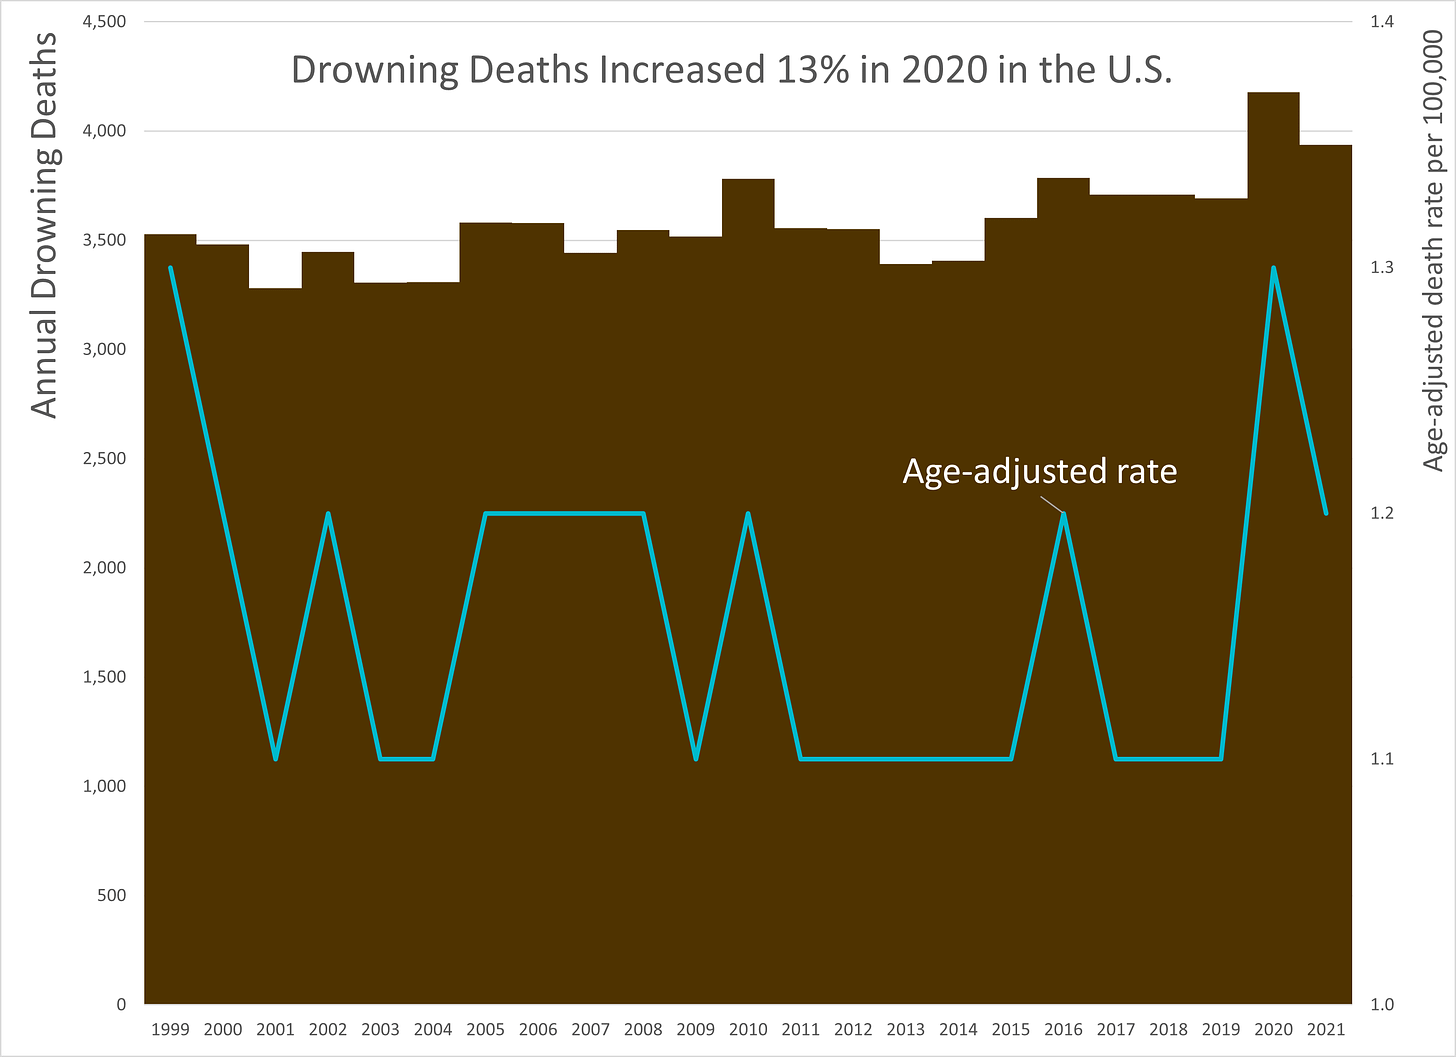
Drowning deaths increased 13% in 2020 in the U.S.
This is something I like to remind people in my networks every Memorial Day weekend, which kicks off “summer” in many Americans’ minds.
It turns out I just noticed a jump in the number of drowning deaths during the pandemic as well.
What a surprise.
Drowning doesn’t look like drowning: the core concept
Before I get into the mortality stats, what “drowning doesn’t look like drowning” means is that what people think drowning looks like, mainly from movies and TV shows, is not what drowning looks like at all.
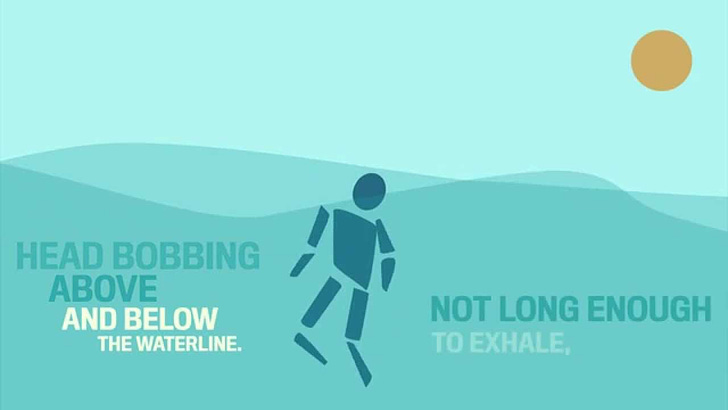
Here is a video version of the explanation:
And here is the article from Mario Vittone in 2013: Drowning doesn’t look like drowning:
Drowning is not the violent, splashing call for help that most people expect.
…..
The Instinctive Drowning Response—so named by Francesco A. Pia, Ph.D., is what people do to avoid actual or perceived suffocation in the water. And it does not look like most people expect. There is very little splashing, no waving, and no yelling or calls for help of any kind. To get an idea of just how quiet and undramatic from the surface drowning can be, consider this: It is the No. 2 cause of accidental death in children, ages 15 and under (just behind vehicle accidents)—of the approximately 750 children who will drown next year, about 375 of them will do so within 25 yards of a parent or other adult. According to the CDC, in 10 percent of those drownings, the adult will actually watch the child do it, having no idea it is happening.…..
Look for these other signs of drowning when persons are in the water:Head low in the water, mouth at water level
Head tilted back with mouth open
Eyes glassy and empty, unable to focus
Eyes closed
Hair over forehead or eyes
Not using legs—vertical
Hyperventilating or gasping
Trying to swim in a particular direction but not making headway
Trying to roll over on the backAppear to be climbing an invisible ladder
Obviously, trained lifeguards should know about these signs, but it doesn’t hurt for parents to know about this. Children (and drunk adults) are the most susceptible to dying by drowning.
Drowning death trend
I decided to take a look at the drowning death trend. The ICD-10 codes for drowning deaths are W65-W74 — Accidental drowning and submersion.
Now the funky line graph for the age-adjusted rate has to do with the CDC reporting that to a single digit past the decimal point, and I happen to agree with them.
Drowning deaths increased 13% from 2019 to 2020, and we’ll look at that a little more in the pattern in a moment.
It does look like total drowning deaths decreased 6% from 2020 to 2021… but that’s actually premature to say. Because I am missing two months’ worth of death data.
Seasonal trend of drowning deaths — much stronger than even flu/pneumonia deaths
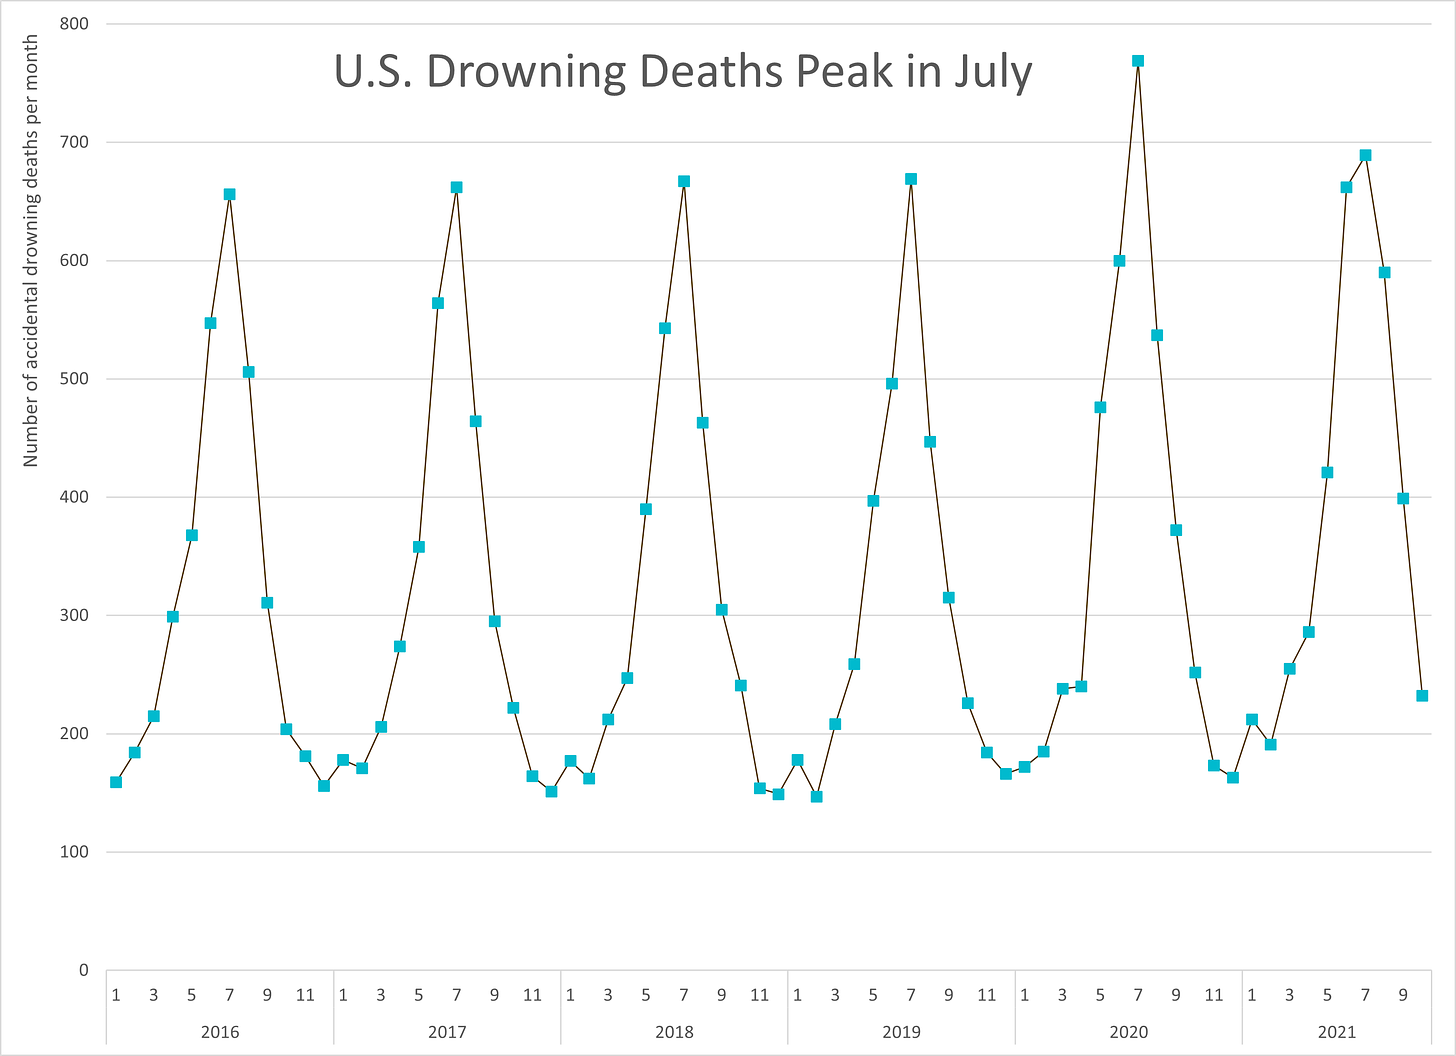
Unsurprisingly, there is a very strong seasonal trend to drowning deaths in the U.S.:
The peak in July 2020 was 15% higher than the July 2019 peak.
I will note that my data end with October 2021, due to the usual censoring of “external” causes of death for 6 months. So 2021 drowning deaths may come in at a level a little lower than 2020, or maybe on a similar level.
The July 2021 peak is obviously lower than July 2020 (it’s 10% less), but the June 2021 number is 10% higher than June 2020 drowning deaths. So it may be a wash ultimately once I get the full year count.
Age structure of drowning deaths
I don’t want to dig into this too deeply:
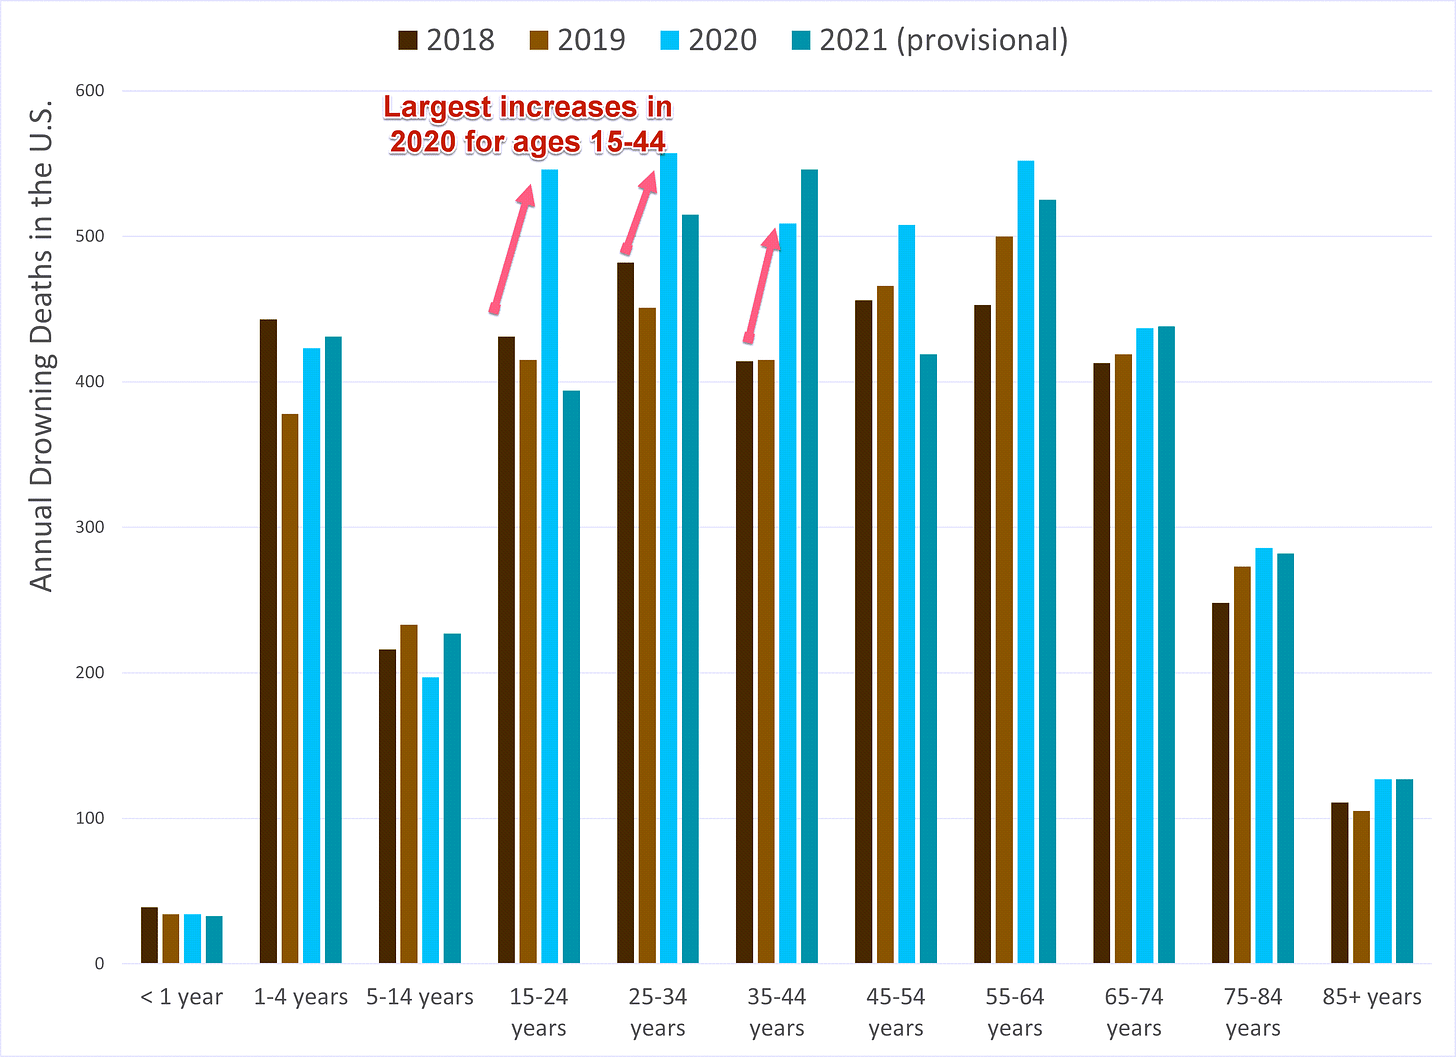
I’m just giving you the count, but I will tell you the rates for age 1-4 is the highest for all the age groups.
As I said, I don’t want to dig into this much. I have 3 kids myself, and I remember freaking out about this risk when my kids were that small. (one of the professional risks of being an actuary is having a really accurate idea of the real nasty risks for one’s children.)
The largest percentage increases from 2019 to 2020 in drowning deaths came in ages 15-44, with the following percentage increases:
Age 15 – 24: 32%
Age 25 – 34: 24%
Age 35 – 44: 23%
This may be related to some of the other risk-taking death increases we saw in 2020, many of which persisted in 2021: drug ODs, motor vehicle accident deaths, and alcohol-related deaths.
The longer this goes on, the more I think of the plague literature of the Renaissance, and some of the reckless behavior being portrayed therein. There are some benefits to studying the humanities, ya know.
Prior “nasties”
Mortality risk for small children
Pools are more dangerous than Covid to small children — and “drowning in pools” is only a portion of the drowning threat to kids age 1-4.
Homicide
Homicide: Trends, 1968-2020, and Provisional Counts Through June 2021
The Geography of Homicide — States, Base Rates, Increases, and Correlations
Motor vehicle accidents
Motor Vehicle Accident Deaths: High-Level Trends, 1968-2020, Part 1
Motor Vehicle Accident Deaths, Part 2: Age-Related Trends with Provisional Results in 2021
Motor Vehicle Accident Deaths, Part 3: Geographical Differences, 2019 vs 2020
Drug overdose deaths
Drug Overdoses, Part 1: High-Level Trends, 1999-2020
Drug Overdose Deaths, Part 2: U.S. Age-Related Trends 1999-2020 with Provisional Results in 2021
Drug Overdose Deaths, Part 3: Geographical Differences for 2019 and 2020
Alcohol-related deaths
Part 1: Dead is dead: Increased Alcohol-Related Deaths, U.S., 2020-2021
Part 2: Alcohol-related deaths, part 2: Geographical Differences for 2019 and 2020
Spreadsheet w/ data:


