Infant Mortality Trends, U.S.: 1999-2022, Provisional, a First Look
Dealing with infant mortality can be very tricky
I have decided to look at infant mortality trends finally, but take notice: this is very different from the usual sorts of older age analysis that I do.
In this post, I’m not even going to look at causes of death yet, because they use an entirely different categorization of causes, and I need to check some aspects.
Highest level trend: generally good, increase in pandemic
Infant mortality is the death rate in the first year of life, but we will see how this breaks out in a moment. If you go to the CDC page on infant mortality, you will see rates quoted per 1,000 live births.
All this time I’ve been using standard death rate scales per 100,000 (except when I use straight percentages) - this is the standard death rate we use, and I will be using the per 100K in future posts for cause of death.
It’s because we get nice round numbers on our scales if we use per 100K instead of ugly-looking 0.7% and even smaller amounts.
Here’s the highest-level result:
From 1999 to 2019, infant mortality decreased 25%, which is fairly good.
From 2019 to 2022, yes, infant mortality increased, but only 4%. Compared to older age groups, that’s not too bad.
Interlude: Older age groups
You can check out the 2019-2022 mortality increases for the other age groups here:
Toddler and Teen Terror 2022 U.S. Mortality: Large Increases Over 2019
Millennial 2022 U.S. Mortality: Drug Overdoses Still Dominate
Gen X 2022 U.S. Mortality: Drug ODs Did Us In More Than COVID
Boomer 2022 Mortality: Much Improved, Still Elevated Over 2019
How Infant Mortality Is Split By Age
As this is the first infant mortality post I’ve done, I’m splitting up my analysis into multiple posts, because I need to explain the age groups.
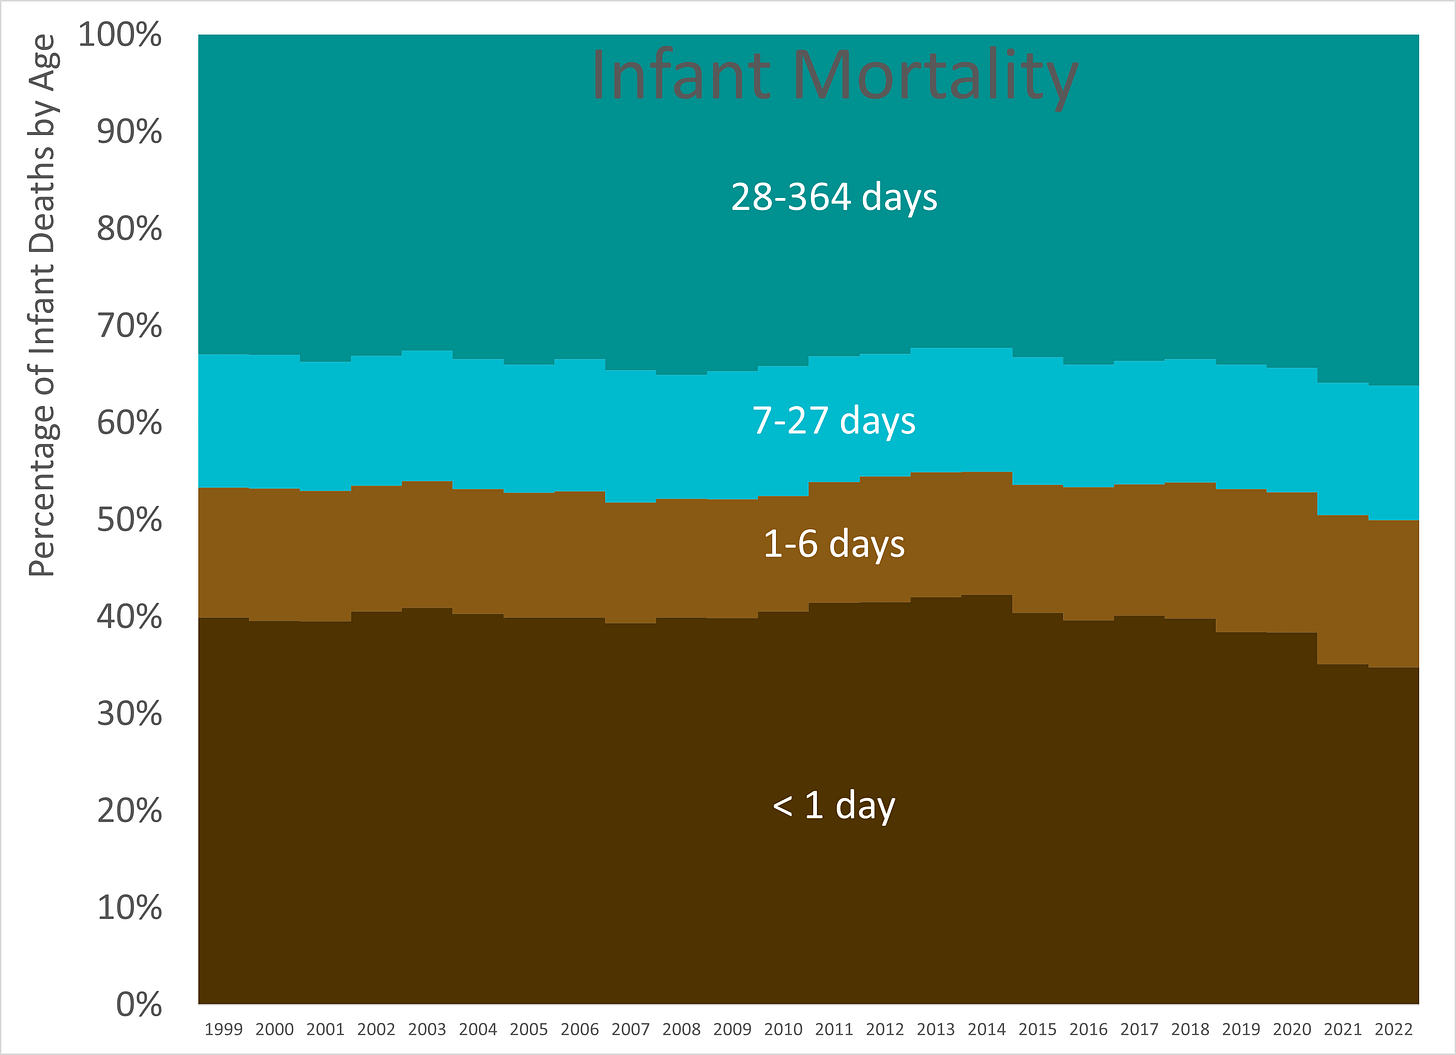
Let me show you a graph, and then we can talk.
So, yeah, when I start breaking this out by cause of death in future posts, this will get heavy.
To make it more stark:
Of all infant deaths, about 40% are in the first day, with over half in the first week.
Almost 70% are in the first month.
So that gives you an idea about how infant mortality goes — it’s very tied to how precarious the situation is for many of the babies who die.
Premature births, low birth weight, lung issues, and a lot of similar causes are recorded for those early deaths.
An Interesting Disparity
Let’s compare our stacked graph with that original line, and let me explain the disparity (as I dug into it):
Hey! They don’t exactly match up! In some years!
So I did some footnote chasing, and here is the deal.
The infant ages (<1 day, 1-6 days, 7-27 days, 28-364 days) are using a denominator for their rate based on live births.
The <1-year death rate is based on population estimates.
The way this can differ, and this is legitimate, is that there is immigration/emigration of infants.
To the extent there would be a lot of infant movement into or out of the country, it would likely be in the 28-364-day age grouping. So if anybody wanted to do some nit-picking adjustment, that’s where it should be done.
I don’t care to make that adjustment.
In high-level movements, it does fit fairly well.
Overall movement by age group
So now let’s stop stacking them up and break them out by age group.
This is difficult to see just looking at the graph, but this is the amount the death rates decreased pre-pandemic, 1999-2019:
<1 day: -24%
1-6 days: -13%
7-27 days: -26%
28-364 days: -18%
So let’s see the changes in the pandemic: (2019 - 2022):
<1 day: -9%
1-6 days: 3%
7-27 days: 9%
28-364 days: 7%
For what it’s worth, the 2022 numbers are likely to change — they have the same birth numbers estimated as for 2021. We know that’s incorrect. Which direction it will go… no clue.
However, the direction of mortality for 2022 is the same as for 2021 — the 1-day mortality was down in 2021 compared to 2019 (same for 2020, by the way). Whatever has been going on to reduce that first-day mortality has continued, even through the pandemic.
So yay!
Let’s take our wins where we can.
The trends at older ages are more ambiguous, and it will likely show when we look at causes of death in a future post (or future posts.


