Gen X 2022 U.S. Mortality: Drug ODs Did Us In More Than COVID
Well, the younger ones, at least -- and cancer went down for the older ones
Continuing on with my cause-of-death analysis for 2022 by age group. Here are prior posts:
This is a look at Gen X, roughly, the age groups of 40-59 years old, carved up into 5-year age groupings. This is last year’s equivalent post:
The age 40-44 group had the worst increase in mortality, with a 52% increase in rate from 2019 to 2021.
Let’s see how 2022 shook out.
High-level rate results for ages 40-59
So, thank goodness, we’ve seen a decrease in 2022. But let’s look at the break out by cause of death.
Age 40 -44, Deaths by Cause
Longer term trend, 1999 - 2022
This graph is the total death rate broken out by cause.
Ugh. I can see it immediately — the worst problem: a huge increase in drug OD deaths.
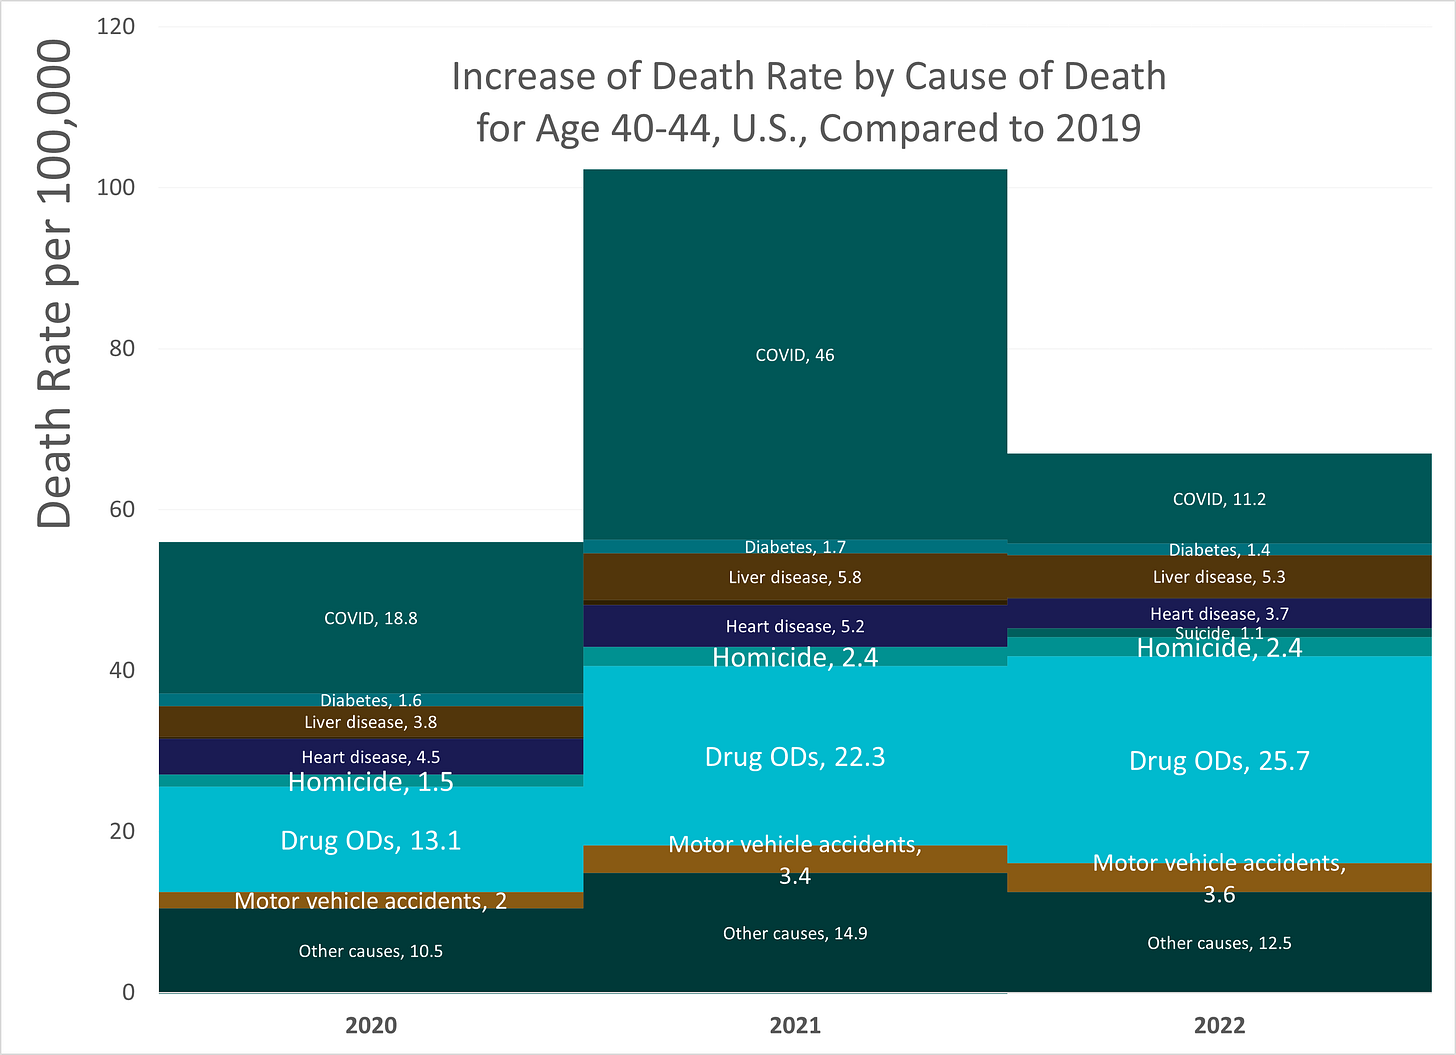
Age 40-44: Attribution of increase in mortality, 2020-2022
This graph shows solely the change since 2019. The COVID death rate in 2022 was lower than that in 2020, which is a good sign.
Not a good sign: the much bigger death rate by drug overdose.
There is also persistent heightened death rate from the other causes - excess death rates that will not necessarily decrease if COVID continues to decrease.
Age 45 -49, Deaths by Cause
Longer term trend, 1999 - 2022
As we go up in age, drug OD deaths are less, and natural causes are more.
Age 45-49: Attribution of increase in mortality, 2020-2022
We’re still seeing the very good trend of improved COVID death rates in 2022, better than even 2020.
But I see drug ODs were still higher.
Age 50 -54, Deaths by Cause
Longer term trend, 1999 - 2022
Now some weird-looking things seem to be going on, but I need to address at the very end of the post.
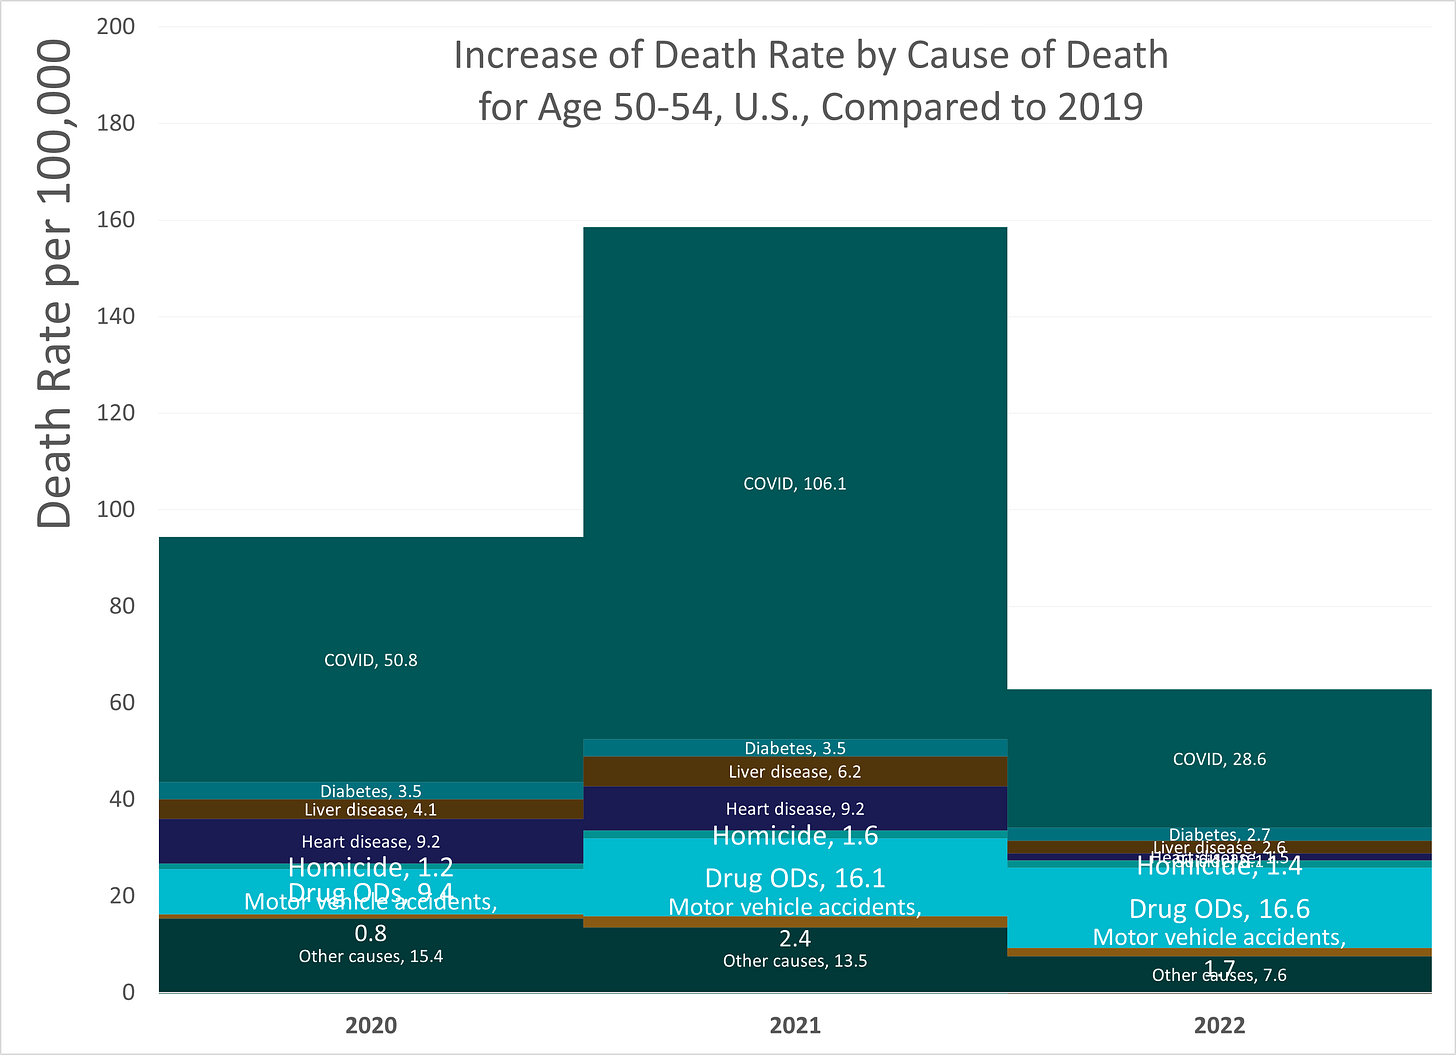
Age 50-54: Attribution of increase in mortality, 2020-2022
Drug ODs still increased even for this group, but look how improved the COVID death rates were!
Age 55 -59, Deaths by Cause
Longer term trend, 1999 - 2022
Look how much COVID shrunk. Cancer did, too, if you notice.
Age 55-59: Attribution of increase in mortality, 2020-2022
And I didn’t mention it until now, but I’ve not been graphing any of the causes of death that decreased in this type of graph. I started the vertical scale at 0.
Notice: the drug ODs also increased.
Summary tables of contribution to excess mortality, ages 40-59
So let us look at the attribution tables, and here we can see the major causes that actually decreased during the pandemic.
2020
Here we can see that cancer did go down, as did suicide.
2021
This was the real killer year — and we still see that suicide and cancer decreased.
2022
And yes, this looks really weird. Let me explain what happened here.
First: drug overdoses were the number one contributor to the increase in mortality for 2022 for ages 40-49; COVID was tops for age 50-59. Drug overdoses were #2 for ages 50-59.
What happened with cancer?
For ages 55-59 years, the cancer death rate decreased from 203 per 100K in 2019 to 182 per 100K in 2022. That was an 11% decrease in rate. Cancer is the number 1 cause of death for this age range.
The total rate increased 8% from 2019 to 2022.
You can see the cancer death rate also decreased for ages 50-54. While other causes increased - this is all complex and interacting.


