Top Cause of Death by Age Group, 2019-2022, Count Tables
Also, a hearty huzzah for weekly CDC WONDER data updates! HUZZAH!
I’ve been pretty busy in prepping for the presentation yesterday (in addition to everything else I have to do) that I totally missed this press release:
As of September 1st, the National Vital Statistics System (NVSS), part of CDC’s National Center for Health Statistics (NCHS), has changed the frequency of provisional mortality data updates in CDC WONDER from a monthly to a weekly schedule.
I have ideas… OH I HAVE SOME IDEAS. But let me let those ferment for a bit.
By the way, here is that presentation from Thursday:
Ranking tables for 2022
Yes, I posted on these before, but we are still getting a few deaths trickling in, and I wanted to put all the combined tables in one post for convenience.
Also, I have added an all-ages column, which you will see when I copy older tables.
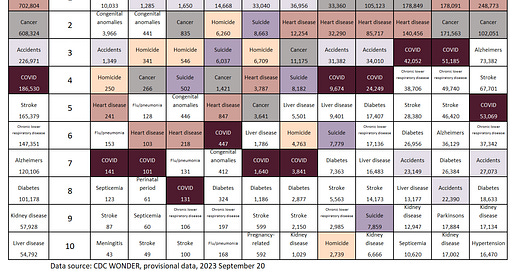
Count of deaths ranking table for 2022
One thing to note, by putting the top 10 for the whole population on the left (as opposed to the right of the table): it’s easier to see how dominated by the causes of the oldest to die.
Homicides and suicides rank very highly among teens and young adults - but they don’t make the top ten for the entire population.
Just in case you wanted to know where certain key causes of death fell in the ranking for the full population:
suicide came in at #11, with 49,459 deaths (so far counted)
flu/pneumonia at #12 with 47,035
homicide at #16 with 24,827
Let’s compare it with prior years.
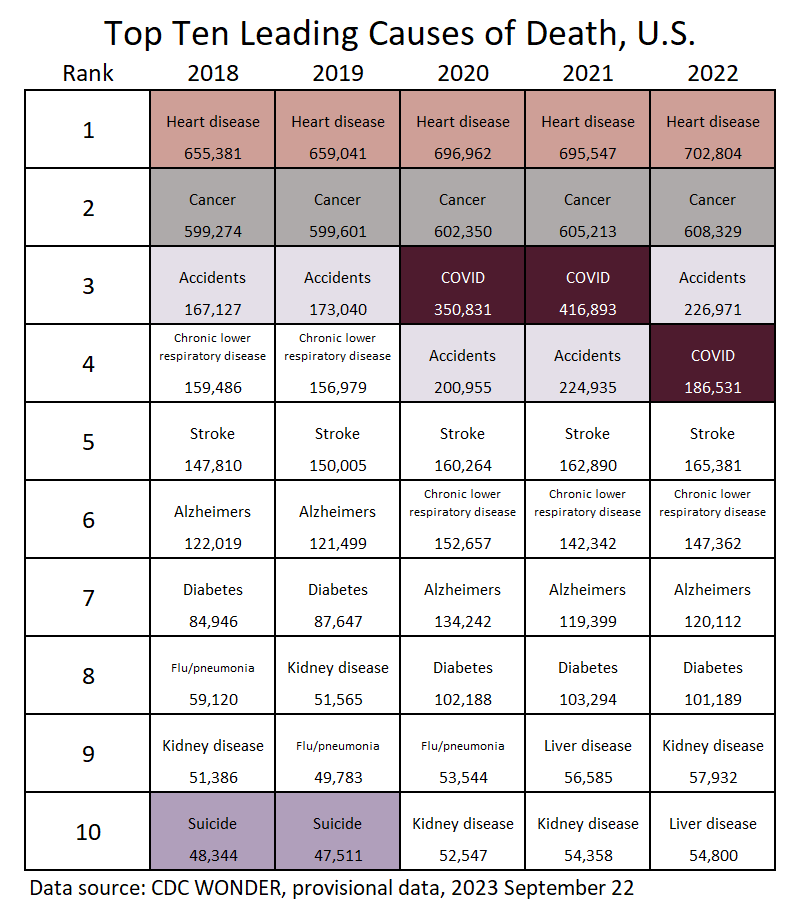
Top 10 for 2018-2022 Table by Count
You can see pre-pandemic that suicide did make the ranking list, as did flu/pneumonia.
Liver disease deaths increased a lot
It’s not just that COVID muscled onto the scene, but that liver disease has jumped up there.
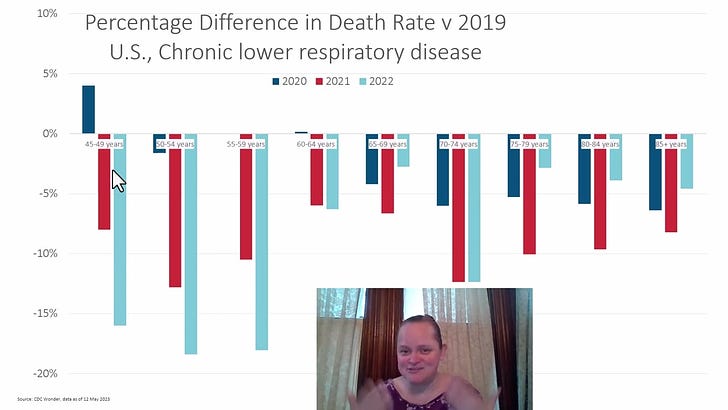
Here is one graph from yesterday’s presentation:
The graph is differently-formatted from what I presented here:
But much of the same problem is going on.
I reference alcohol abuse, which of course can kill one fairly quickly (if one is determined), but other things could have been leading to liver damage so rapidly as well.
Prior year ranking tables by age
Let’s get the prior years back to 2019, so you can see how these have evolved.
There are some particular patterns to note in changes (not just the liver disease item). Obviously, COVID is a large part of this narrative, going up and down, as well as the total number of deaths by age group.
Keep an eye on that 85+ age group — there are large up and down movements.
These tables I created a while ago, so I don’t include the top 10 for the whole population, as seen above.
Top causes of death for 2021 by age group
This was the worst year for COVID deaths for most age groups… except for the oldest.
Wait til you get to the 2020 ranking table. You might want to think about what happened to make 2020 the worst for the oldest people, and 2021 the worst for everybody else.
Top causes of death for 2020 by age group
The main thing to note: total deaths for age 85+ are higher in 2020 than in 2021 and 2022.
For other age groups, mortality was higher in 2021 than in 2020.
Top Causes of Death for 2019 by Age Group
This is what a “quiet” year looked like. Just for reference.
Spreadsheets
Prior Ranking Tables Posts
July 2023: 2022 Top Causes of Death in the U.S. by Age Group - these are provisional. Finalized stats won’t come out before December 2023.
Jan 2023: Top Causes of Death, US, 2018-2021
Jan 2023: Top Causes of Death by Age Group, 2021: Finalized U.S. Stats
May 2022: Top Causes of Death for 2021: Heart Disease, Cancer, and COVID
Jan 2022: Top Causes of Death by Age Group, 2020: Death Rates
Jan 2022: Top Causes of Death by Age Group, 2020: Raw Numbers
Apr 2021: Mortality with Meep: Top Causes of Death in the United States in 2020
June 2017: Mortality Monday: Cause of Death, 2014 — I actually get into detailed cause of death here


