Boomer 2022 Mortality: Much Improved, Still Elevated Over 2019
Mortality for 2022 still mainly driven by COVID, but with some other causes of death increasing
Continuing on with my cause-of-death analysis for 2022 by age group. Here are prior posts:
This is a look at Baby Boomers, roughly, the age groups of 60-79 years old, carved up into 5-year age groupings. This is last year’s equivalent post:
As I look at 2022, it will surprise nobody that the excess mortality was also mostly COVID, though it was not the primary cause of death (that’s still cancer and heart disease — top causes of death for all ages over age 45.)
High-level rate results for ages 60-79
As you can see, the younger seniors did see a reduction in death rates in 2022, except for ages 75-79 years old.
However, event with the reduction in 2022 for the younger ages, the result in 2022 was still over 10% higher than what was seen in 2019.
As we will see below, when I break it out by cause of death, the predominant driver for this increase in mortality was COVID. However, there are some other causes of death creeping up.
I didn’t show it in these graphs, as I’m showing annual trends, but most of the COVID deaths were in the first three months of 2022. The other causes of death are more evenly spread out.
The question is that if COVID remains relatively low, as we have seen in 2023, will these other causes of death continue to grow in terms of causing a bad trend in mortality?
Age 60 -64, Deaths by Cause
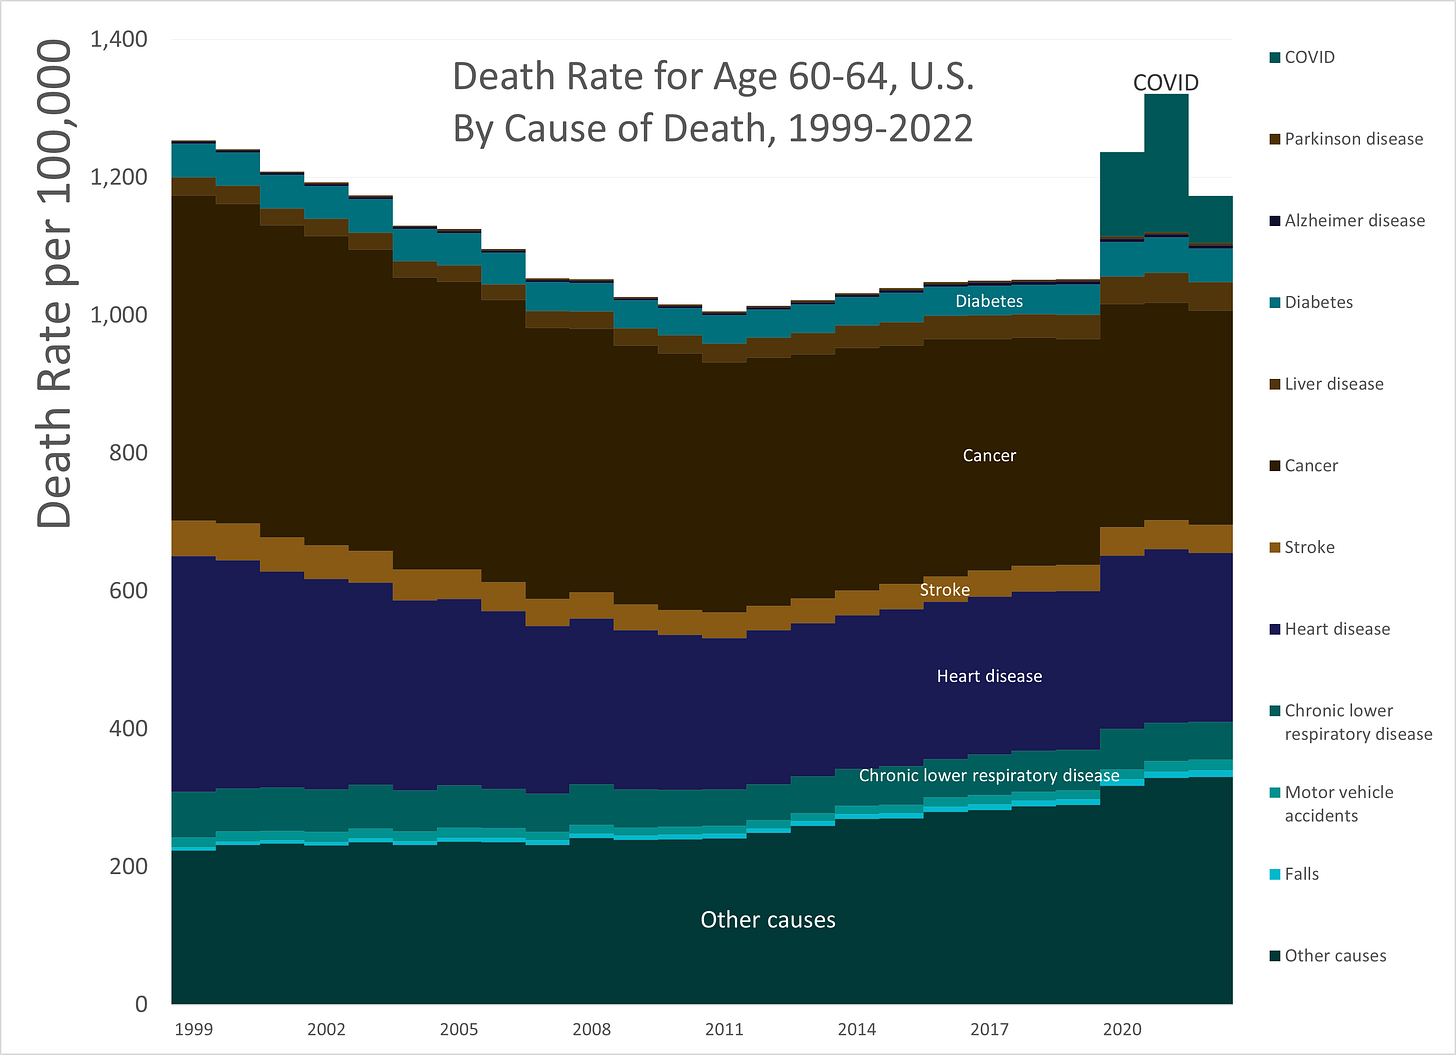
Longer term trend, 1999 - 2022
Two things to notice before we get to the pandemic-specific changes:
After hitting a low death rate about 2010, death rates for this age group increased even pre-pandemic. This is something to keep in mind when we think of likely post-pandemic trajectories.
Cancer is the number 1 cause of death for this age group, followed by heart disease. This was also true during the pandemic.
Age 60-64: Attribution of increase in mortality, 2020-2022
In this and later comparisons, as I did with the Silent Generation post, for the non-COVID causes of death, I will compare the rates of causes of death for 2020-2022 against the rates in 2019.
In the above graph, I am only showing the causes that increased in 2020-2022. In the tables below, you will see which ones actually decreased (and by how much).
As you can see, COVID had the largest impact for any single cause of death for all the years, with COVID shrinking a huge amount in 2022.
We see the catch-all “other causes” is growing. It’s still about the same level as 2021, so we will move on for now.
Age 65 -69, Deaths by Cause
Longer term trend, 1999 - 2022
While the 65-69 age group had a little bit of stalling out of mortality improvement pre-pandemic, similar to the age 60-64 group, it was not as stark.
Cancer was also the #1 cause of death for this age group, with heart disease as #2.
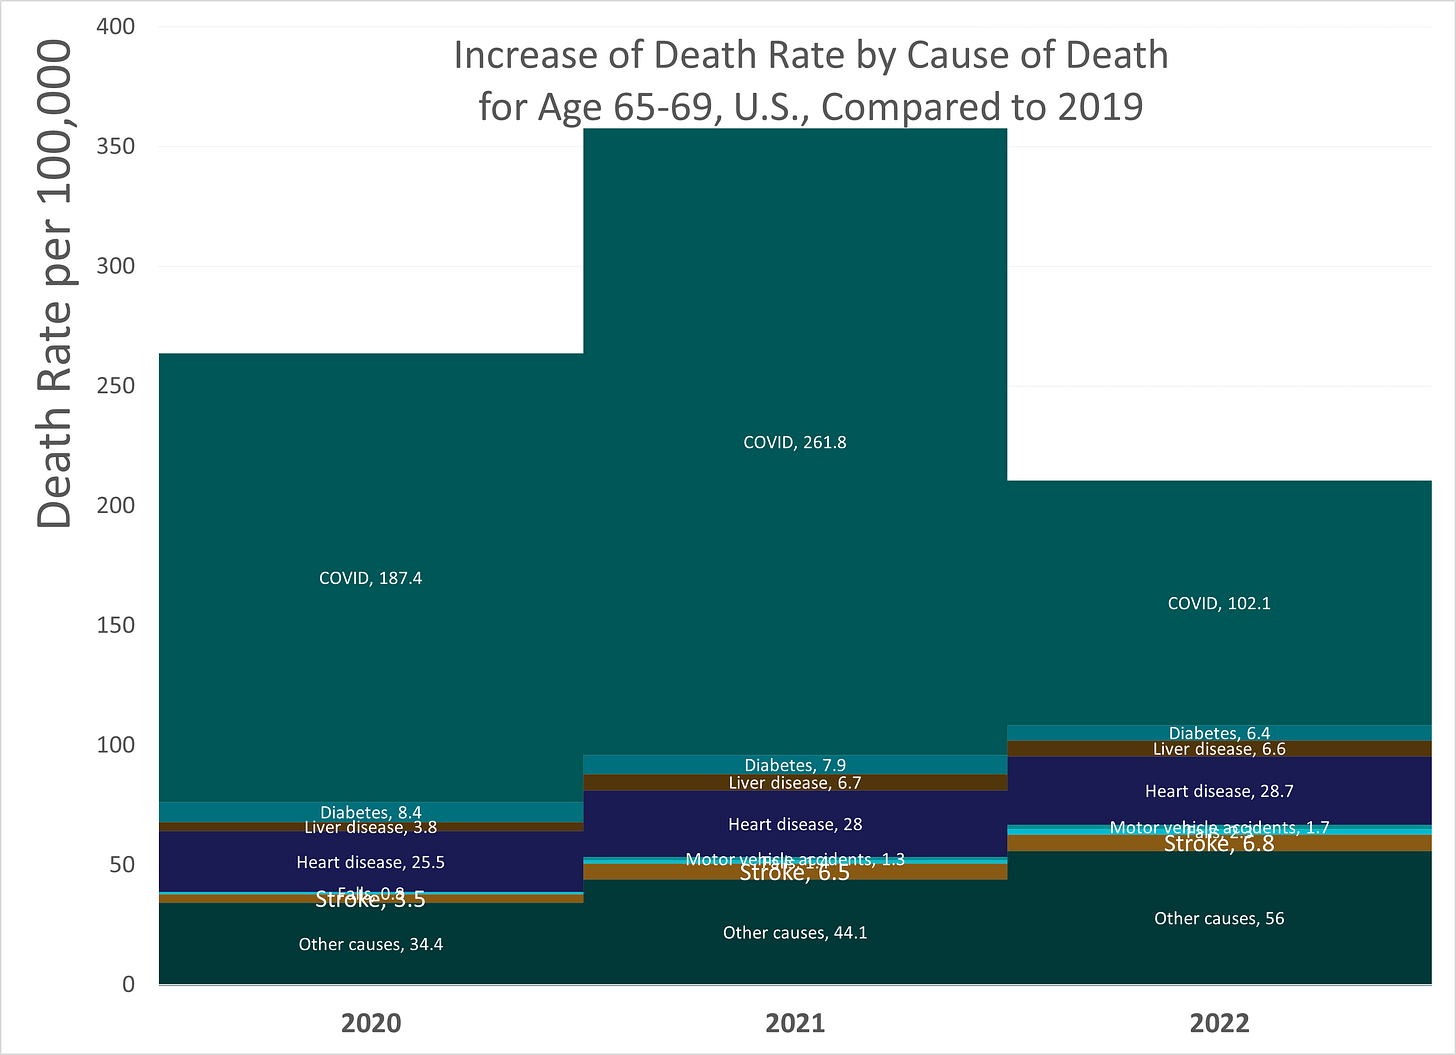
Age 65-69: Attribution of increase in mortality, 2020-2022
Again, COVID is the primary driver of excess mortality, even with a huge drop in 2022.
We are seeing an even stronger increase in the “other causes” trend, and some other causes are also showing an increasing trend: stroke (it’s still slight) and heart disease.
Age 70 -74, Deaths by Cause
Longer term trend, 1999 - 2022
Again, a somewhat ambiguous mortality trend immediately preceding the pandemic, but generally improving over the pre-pandemic period.
Cancer is #1, heart disease is #2.
This is the point at which you may be wondering: wait, isn’t heart disease the #1 cause of death in the U.S.?
Yes, it is. Even during the pandemic. Cancer was #2.
But not for any of the age groups 60-79. It doesn’t switch over until the very old. Most deaths are among the very old.
Age 70-74: Attribution of increase in mortality, 2020-2022
Again, we’re seeing most of the contribution, by a large amount, to be coming from COVID.
Increasing contributions can be seen in heart disease and other causes, though.
Age 75 -79, Deaths by Cause
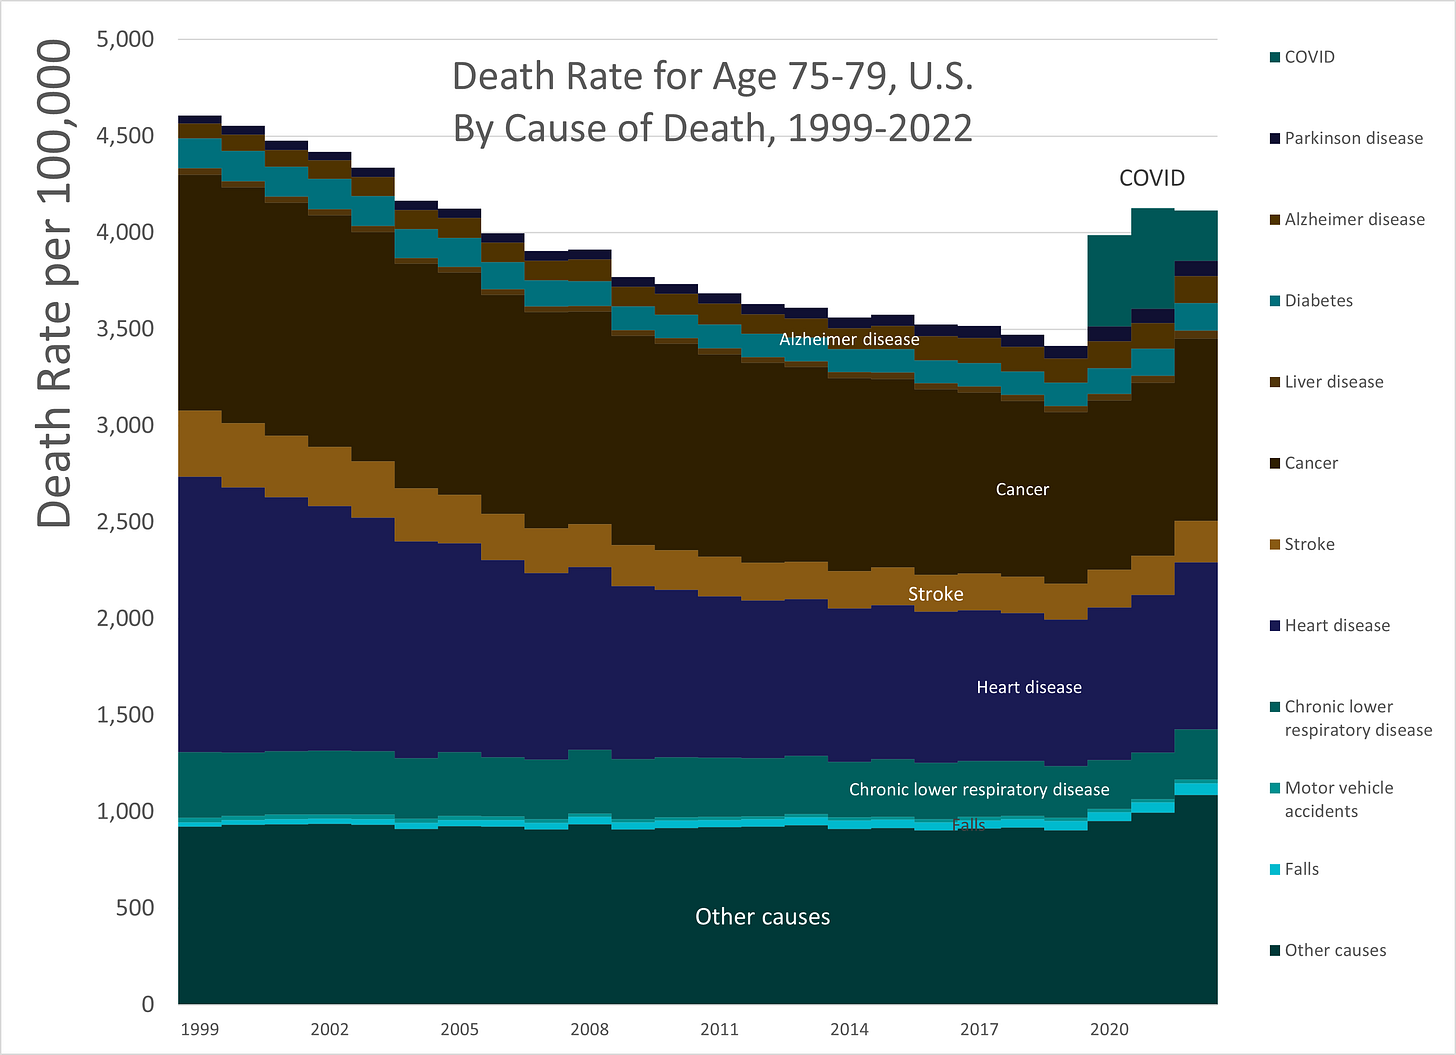
Longer term trend, 1999 - 2022
With this oldest age group among the Baby Boomers, cancer and heart disease are still #1 and #2, in that order, but you can see that they had a different trajectory during the pandemic than the younger age groups saw.
Also, cancer and heart disease death rates for age 75-79 are a lot closer to each other than what we see for cancer and heart disease at the younger ages.
Age 75-79: Attribution of increase in mortality, 2020-2022
Now we see something very different.
Look at what’s going on with heart disease and cancer, not to mention “other causes”, which I should dig into for the older ages.
While COVID death rates decreased greatly for ages 75-79, due to the increase in these other causes of death, the overall death rate for this age group essentially went sideways for 2022.
Summary tables of contribution to excess mortality, ages 60-79
So let us look at the attribution tables, and here we can see the major causes that actually decreased during the pandemic.
2020
2021
2022
To keep this simple: I do need to dig into that “other causes” more to see what’s contributing.
You can also see that in some cases major causes of death (cancer, chronic lower respiratory disease) decreased to balance increases from other causes - displacement activity.
But the main item I want to point out is that substantial contribution of heart disease to the increase in mortality.


