Happy Labor Day! Workplace Death Trends
I love the Bureau of Labor Statistics - have a Happy Labor Day, y'all!
You know me, all with the counting deaths.
I also enjoy really dated workplace safety films and people riffing on them.
Ba-dun-dun…. Shake hands with danger…. la la la … Three-fingered Joe…”
…That is a catchy tune. Pity about the hand.
Workplace Fatalities 2017-2021
I generally don’t look at workplace fatalities — that’s not been a large part of mortality for the trends I’ve been looking at.
However, given the kick-up in accidental causes of death (particularly motor vehicle accident deaths… and some of those could have been delivery drivers of various sorts) during the pandemic, let’s take the last report of the Census of Fatal Occupational Injuries Summary, 2021.
They have graphs, but I dislike them (and they screwed up the implementation of a few), so I took their stats and redid them below.
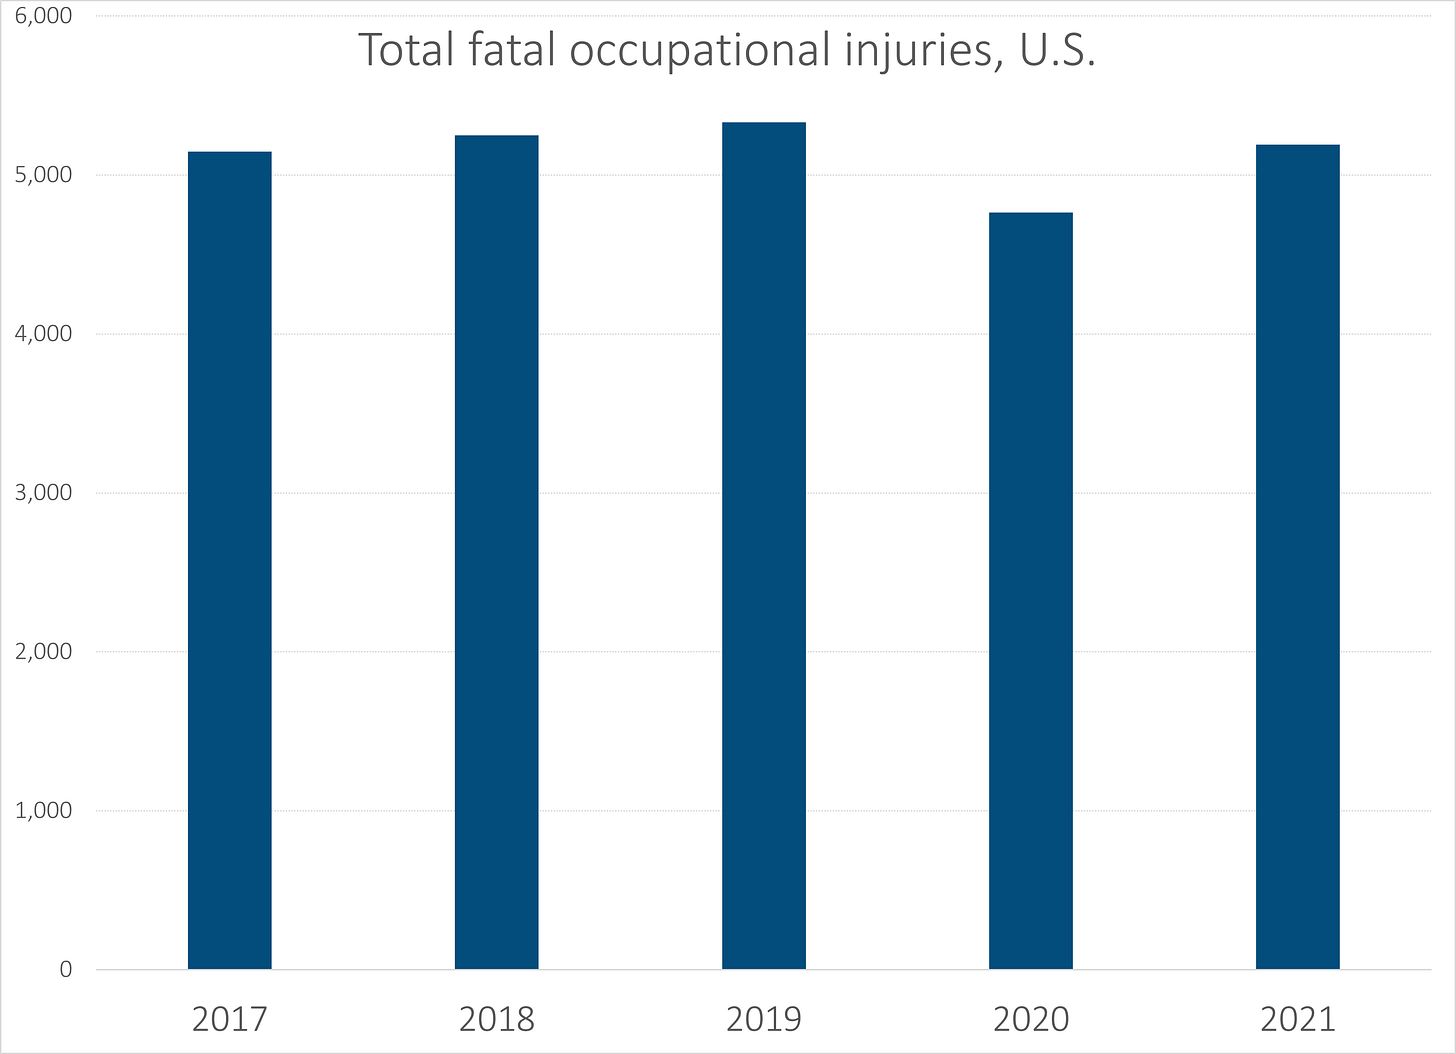
Here is the total number of fatal occupational injuries by year:
You can see the drop-off in 2020 (gee, I wonder why).
Age structure of Fatal Occupational Injuries 2017-2021
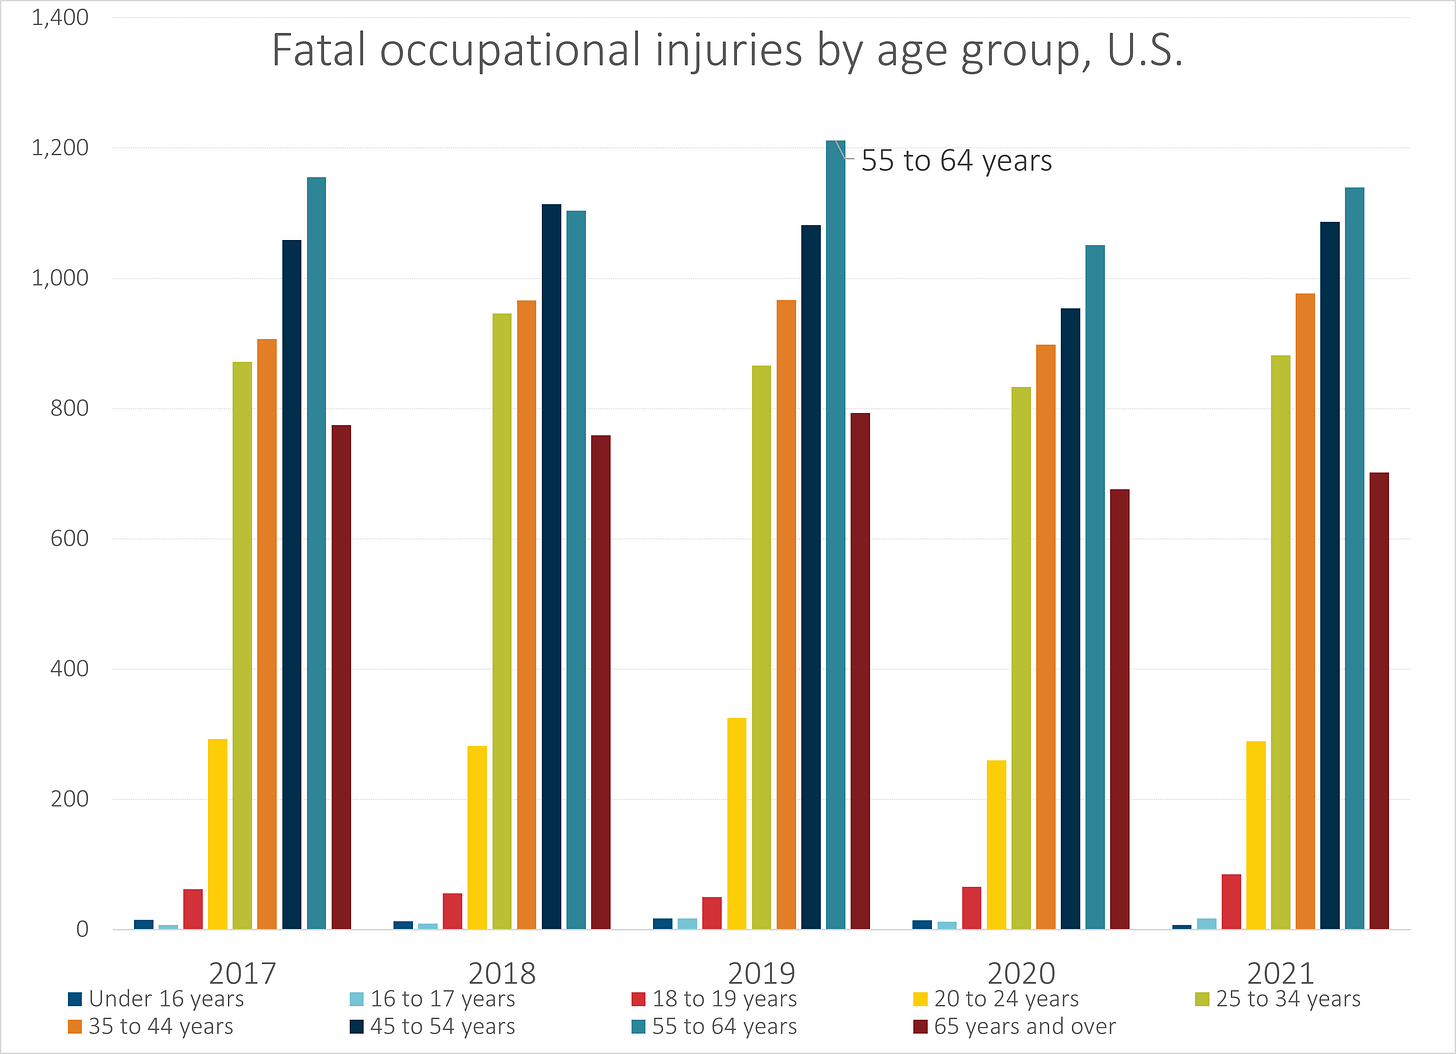
You can grab the age structure, by total numbers:
By their age groupings, those under age 25 don’t have as many fatal occupational injuries as the Boomers.
For those under age 20, it makes sense — frankly, the big, dangerous jobs are not given to teenaged boys (and, let’s face it, it’s mainly males who are dying this way… but not only. We’ll see that in a moment.)
Age 55-64 years old is older Gen Xers and Baby Boomers, and they have the peak… but is that just because they outnumber others in the workforce, or are they dying at a higher rate?
Death Rate by Age, Fatal Occupational Injuries 2017-2021
Yep, they calculate a rate for that, too — and the rate is not the standard sort of death rate I calculate for my usual death rate graphs. Instead of per 100,000 people per year, it’s per 100,000 full-time equivalent employees per year.
There is definitely an age component here.
It does seem that the senior fatal injury rate is decreasing, which may be a function of the most frail seniors dropping out of the workforce (especially in the pandemic… and dropping out in a very final way.)
Let me drop a few more graphs based on the data for interest:
Count by Sex
Great news! Women are increasing their share of fatalities!
(Yes, I’m being sarcastic.)
Women were about 7% of the fatalities in 2017, and 9% in 2021.
Count by Race/Ethnicity, 2017-2021
Both the Hispanic/Latino and non-Hispanic Black counts increased by about 25%.
Private industry sector, 2021
Okay, I try to avoid combination graphs like this, but I am pointing this out for the disparities in the count of deaths and the rate of deaths.
We often talk of logging specifically (in the “Agriculture, forestry, fishing, and hunting” sector) as the most dangerous profession, up there with open ocean fishing (in/near Alaska). The rates of death for logging and blue ocean fishing are very high, which is shown with the light blue square markers/line.
However, construction has a higher number of deaths… as far more (men) work in construction than either logging or fishing.
You can see that with other sectors as well, like retail trade, which has a lot of people working in it, and got a couple of hundred deaths, but the rate wasn’t so bad, because the number of FTEs in that sector is fairly high.
I could have made a similar graph by occupational group, but you would have seen very similar results.
Stay safe, and don’t shake hands with danger!
(da-da-da)


