It’s back to school time up here in New York, so what a perfect time to revisit an old post: Teacher Pensions: A Big Problem for Many States.
Here was my rundown for the reasons:
There are a lot of teachers
Teachers are long-lived
The particular way some states take over the funding of local teachers’ pensions (not all states, but many do)
Newer teachers are paying for older teachers’ pensions
Teachers pensions are grossly underfunded (tied to the prior reasons)
That post was from 2019, so let’s check in with the reasons for any updates.
Teachers are numerous
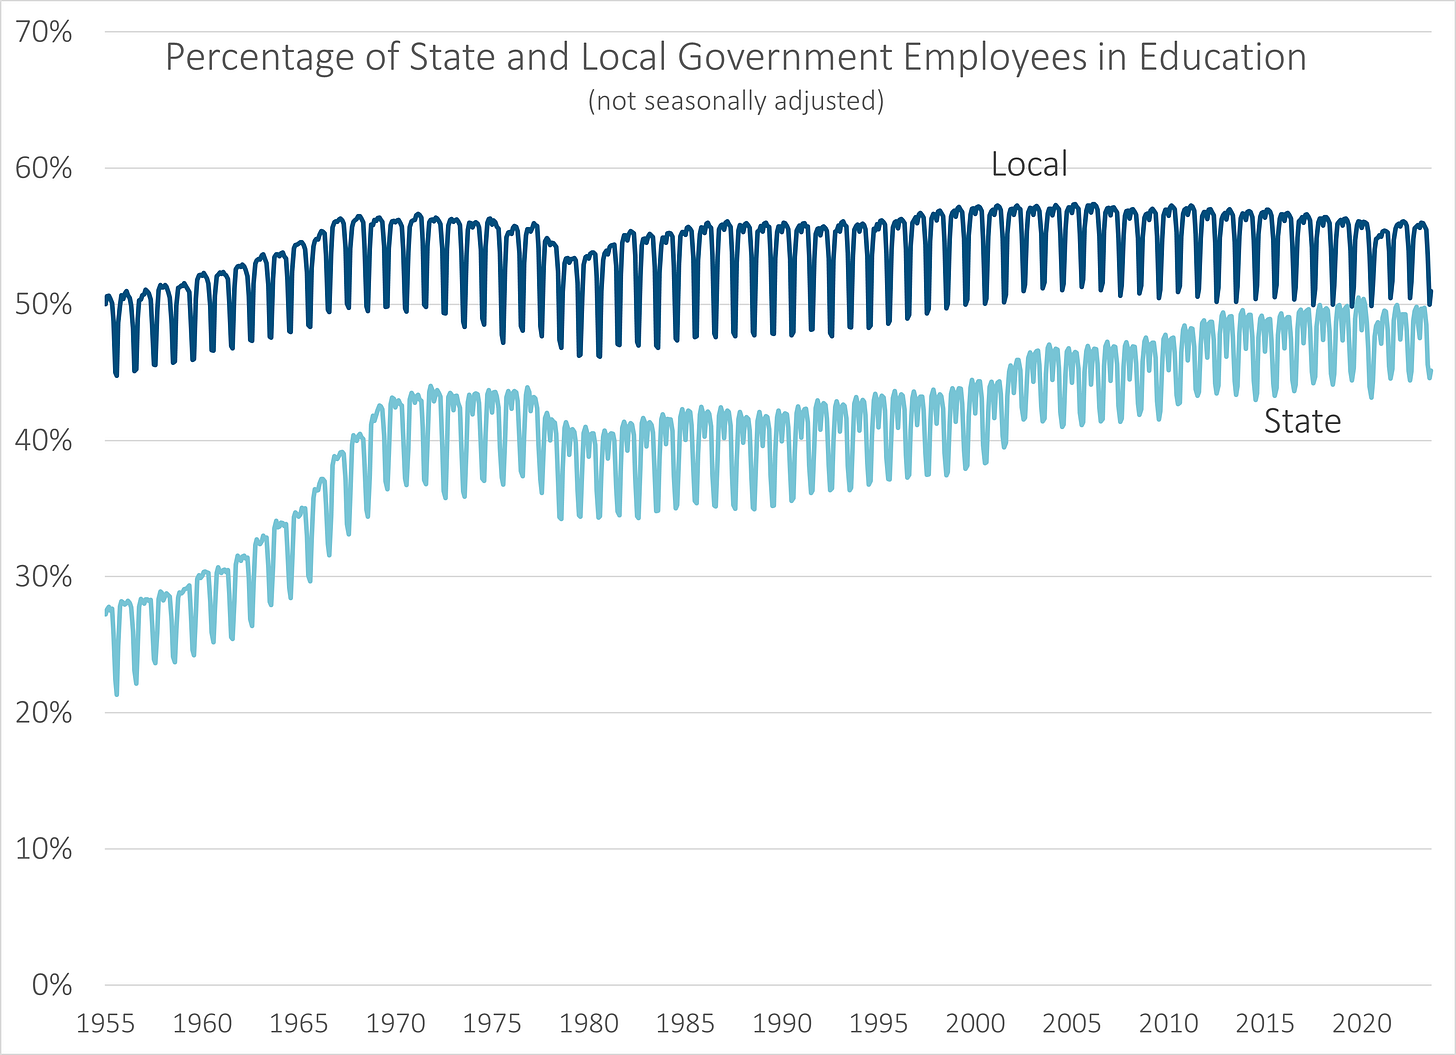
Education employees (by sector) constitute the largest portion of state and local employees. Using un-adjusted numbers, here are the percentages of state and local employees who are in education:
Unsurprisingly, it’s over 50% of local employees, but what’s interesting is the increasing percentage of state employees. I assume public university staff count, but it is interesting how close to 50% these percentages are getting. So this isn’t solely teachers, per se, but these are often the people covered by teachers’ pensions.
And yes, I used the data going back to 1955, because some of the pension problems have to do with very old service. To be sure, those giving service back in 1955 are unlikely to be getting much in pensions now.
But there are plenty of people who may have been teaching 50 years ago still receiving pensions because of the next point.
Teachers are long-lived
Not only do teachers tend to live longer than the general public, they tend to live longer than other government employees.
I’m not simply talking about education being dominated by females, though that is partly true as well.
The Society of Actuaries did its own public pensions mortality experience study covering a variety of plans, with the following results: [I made the highlight]
To give you some numbers, the SOA researchers started with their base tables from experience studies (PubT is teachers, based on 2010; PubS is Safety Officers; PubG is general public employees), and then they used a standard private pension mortality table RP(H)-2006 as a base comparison. These are headcount-weighted (that is, actual numbers of people, as opposed to salary-weighted, etc.)
These are old tables, so to make them current they use a mortality projection scale - MP-2017. The way you use mortality projection scales (and they can be structured a variety of ways), it does matter the number of years you’re projecting.
Here are the life expectancy results from age 65 — so pretend they’re retiring at age 65:
Note that this is life expectancy from a single age, so that even though there is almost no difference for public safety officers, whether male or female, to use the public-plan-specific mortality tables, there may still be a reason to switch to those.
I’ll ignore the general public employee mortality differences for now.
However, notice that for both male and female teachers, the teacher-specific mortality tables increase the life expectancy by over 11%. It increases the life expectancy even more for males than for females.
This is just getting into the weeds to say: teachers live longer than police officers, fire fighters, general government employees, and your normal union workers receiving defined benefit pensions.
States Funding Local Pensions
This does not occur in all states. It’s specific states, like Connecticut and Illinois, a function of some very dysfunctional politics and public finance.
This is how it “works”: a locality may set the local teachers’ salaries, but the state will pick up the employer’s portion of the pension contribution.
Now, you may think this isn’t so bad - the locality picks up the salary, which is much bigger than the pension contribution.
Except some localities do this nice little trick called spiking, which involves boosting the last few years of a teacher’s salary so as to make their final average salary much higher than a “natural” progression of their salary… and sometimes, depending on how the pension benefit is calculated, it can really be gamed.
Illinois “attempted” to rein in the spiking via penalties, but it didn’t do much.
The main way to remove spiking is to come up with a pension benefit formula that doesn’t reward spiking, like using a career average salary (like with Social Security, though that’s indexed).
In any case, it’s only a few states that have this craptastic set-up.
And once it is set up, it is almost impossible to dislodge, especially because it rewards the richest school districts the most.
Newer Teachers Paying for Older Teachers' Pensions
I was talking about Illinois TRS Tier 2 here.
Frankly, this was specific to Illinois and I’m moving on (for now).
Illinois TRS is just a big ball of suck and it is going to get its own prize by the end of this.
Teachers’ Pensions are Grossly Underfunded
Yes. Here we go….
….later.
I will be doing ranking tables of the various teachers’ pension funds, not only based on funded ratios (because that would be silly), but also looking at the funding patterns and some other metrics, using my old standby, the Public Plans Database.
But as a teaser, here is graph of what happened with the funded ratios of teachers’ pension plans in the U.S., as a result of what you see above.
You can see that by the far right of the graph, which is fiscal year 2022, the median funded ratio is still under 75%.
The “top” funds are just scant of 100% funded — but there are only a few funds sitting there.
But even 20 years ago, very few funds were fully funded, that is, at least 100% funded.
The median funded ratio, unsurprisingly, fell during the financial crisis of 2008, which would show up during fiscal year 2009.
But as you can see, funded ratios have barely recovered since then, though there had been over a decade of a bull run during that time.


