Cancer Trends among Young Adults: An Issue of Rates and Types
Longer-Term trends, 1999-2023, plus a correction on yesterday's post
Continuing the theme of yesterday’s post:
No Fooling: Cancer in Young Adults — Pandemic-Driven or Long-Term Trend?
Holy Week and Easter pushed this off a bit, but this is time to return to the subject. Recent Cancer-Related Posts Let us look at recent posts and key graphs: 4 Feb 2024: World Cancer Day 2024: History of Mammography, Recent Research, and Some Trends
In today’s post, I will be looking at the group of young adults, aged 15-44 years old, and cancer death trends from 1999 to 2023.
A Correction from yesterday: What Has Been the Increase In Early-Onset Cancers?
In responding to yesterday’s post:
So here’s the original article:
Global trends in incidence, death, burden and risk factors of early-onset cancer from 1990 to 2019
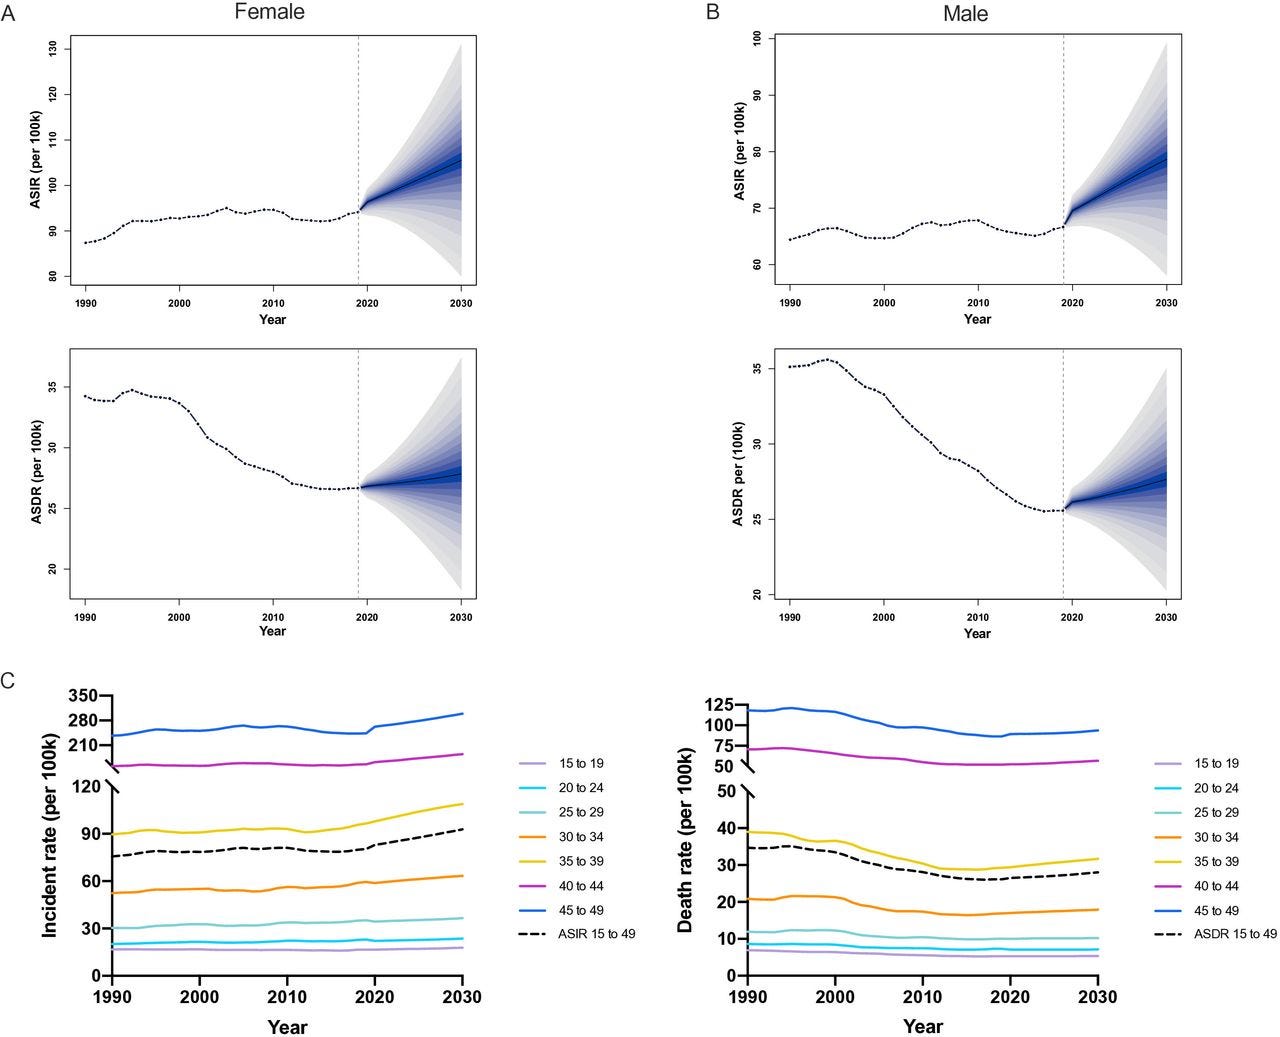
Karl Pettersson was referring to this figure:
Trends of ASIR and ASDR in the early-onset cancer in female (A), male (B) and both sex (C): observed (1990–2019) and predicted rates (2020–2030). The blue region in (A) and (B) shows the upper and lower limits of the 95% uncertainty intervals (95% UI). ASIR, age-standardised incidence rate; ASDR, age-standardised death rate.
Karl’s point about age-adjusted death rates is well-taken due to the aging of populations in general.
Those uncertainty cones seem reasonable to me. The future is pretty uncertain — I would think you’d want a mortality fluctuation represented by COVID in there. That was far from the extremes of the Black Death.
But I do agree that any news article should keep those cones of uncertainty for projection, to distinguish it from the historical results.
The incidence seems somewhat “sideways” to me, and the death rates have decreased in those graphs.
Age-Adjusted Cancer Death Rates Difference
Cancer, like most natural causes of death, has a general increasing rate with age that takes a Gompertz-Makeham form, so if the young adult age distribution shifts so that it’s more weighted towards those aged 35-44 versus 15-24, that can be enough to shift an appropriately normalized metric.
Actually, because of the Baby Bust that is the Gen X generation (howdy!), and the glut of Baby Boomers, in 1999 the 15-44 year-old cohort was 36% in the 35-44 bucket and in 2023, it was down to 33%. This does have something of an effect.
Here is my comparison in what I have looked at, using the age group 15-44, standard U.S. 2000 population for weighting in age-adjusted results.
It is interesting how the age-adjusted death rate diverges from the crude death rate here.
The general trends are the same in that from 1999 to 2020, the death rates decreased. The crude death rate decreased at about 2% per year, and the age-adjusted death rate decreased 1.7% per year.
But from 2020 to 2023, the cancer death rates have increased. The annual increase is small, so let me give you the cumulative: 1.8% cumulative for the crude rate and 1.4% for the age-adjusted rate.
Cancer vs. Heart Disease post-pandemic
These are not large increases, to be sure, but cancer is a top cause of death. Most of the time, young adults are dying from external causes of death such as accidents, homicides, and suicides:
As you can see that cancer is tops for the middle-aged, with cancer deaths far outstripping heart disease deaths for those aged 55-74.
But for young adults, heart disease and cancer deaths are very close in number, with them flipping order sometimes.
Let’s look at the pre-pandemic year of 2019:
Again, external causes of death are tops, but you can see cancer and heart disease are very close in their rates for the young adult group.
Key cancer types?
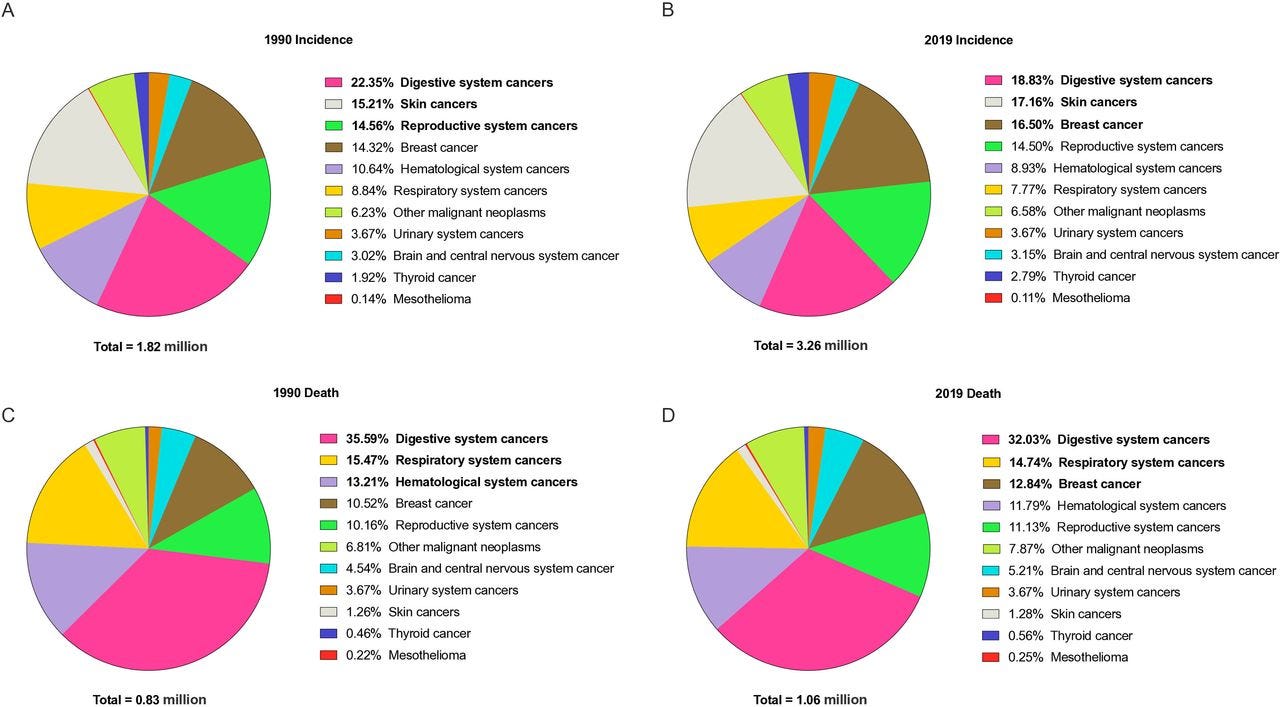
In the BMJ paper, they have this ugly set of pie charts:
Distribution of cases and deaths for the early-onset cancers of different systems in 1990 and 2019. The early-onset cancer types in bold are the top three. Respiratory system cancers include larynx cancer, nasopharynx cancer, other pharynx cancer and tracheal, bronchus, and lung cancer; digestive system cancers include colon and rectum cancer, oesophageal cancer, gallbladder and biliary tract cancer, lip and oral cavity cancer, liver cancer, pancreatic cancer and stomach cancer; haematological system cancers include Hodgkin’s lymphoma, leukaemia, multiple myeloma and non-Hodgkin’s lymphoma; reproductive system cancers include cervical cancer, ovarian cancer, testicular cancer and uterine cancer; urinary system cancer include bladder cancer, kidney cancer and prostate cancer; skin cancers include malignant skin melanoma and non-melanoma skin cancer.
In the ICD-10 (and its predecessor, ICD-9) system, these are lumped together. Recall that the above are from a global data set, not U.S. alone. I will be using some different groupings, but you will see they are somewhat similar in result.
One thing you can see in the above graph is the decrease in lung cancer deaths, so yay there. However, one can see that colon (or colorectal) cancer deaths were growing.
Let’s break it out by percentage:
This gives us an idea where to look, and which cancers are most significant in driving trends for this age group.
I will continue on this theme tomorrow, pulling out specific cancer types to look at for this age group.
Again, I’m looking at both longer-term trends as well as what may be driving short-term changes for 2020-2023.
Spreadsheet


I haven't seen cones of uncertainty before. These seem like very wide variation possibilities. Is that usual?