Why Has Teen Mortality Increased 31% in 2 Years in the U.S.?
External causes have driven a relatively high increase, not COVID
Spoiler: it’s not COVID.
This was going to be a post about pediatric mortality in general. But I changed my mind.
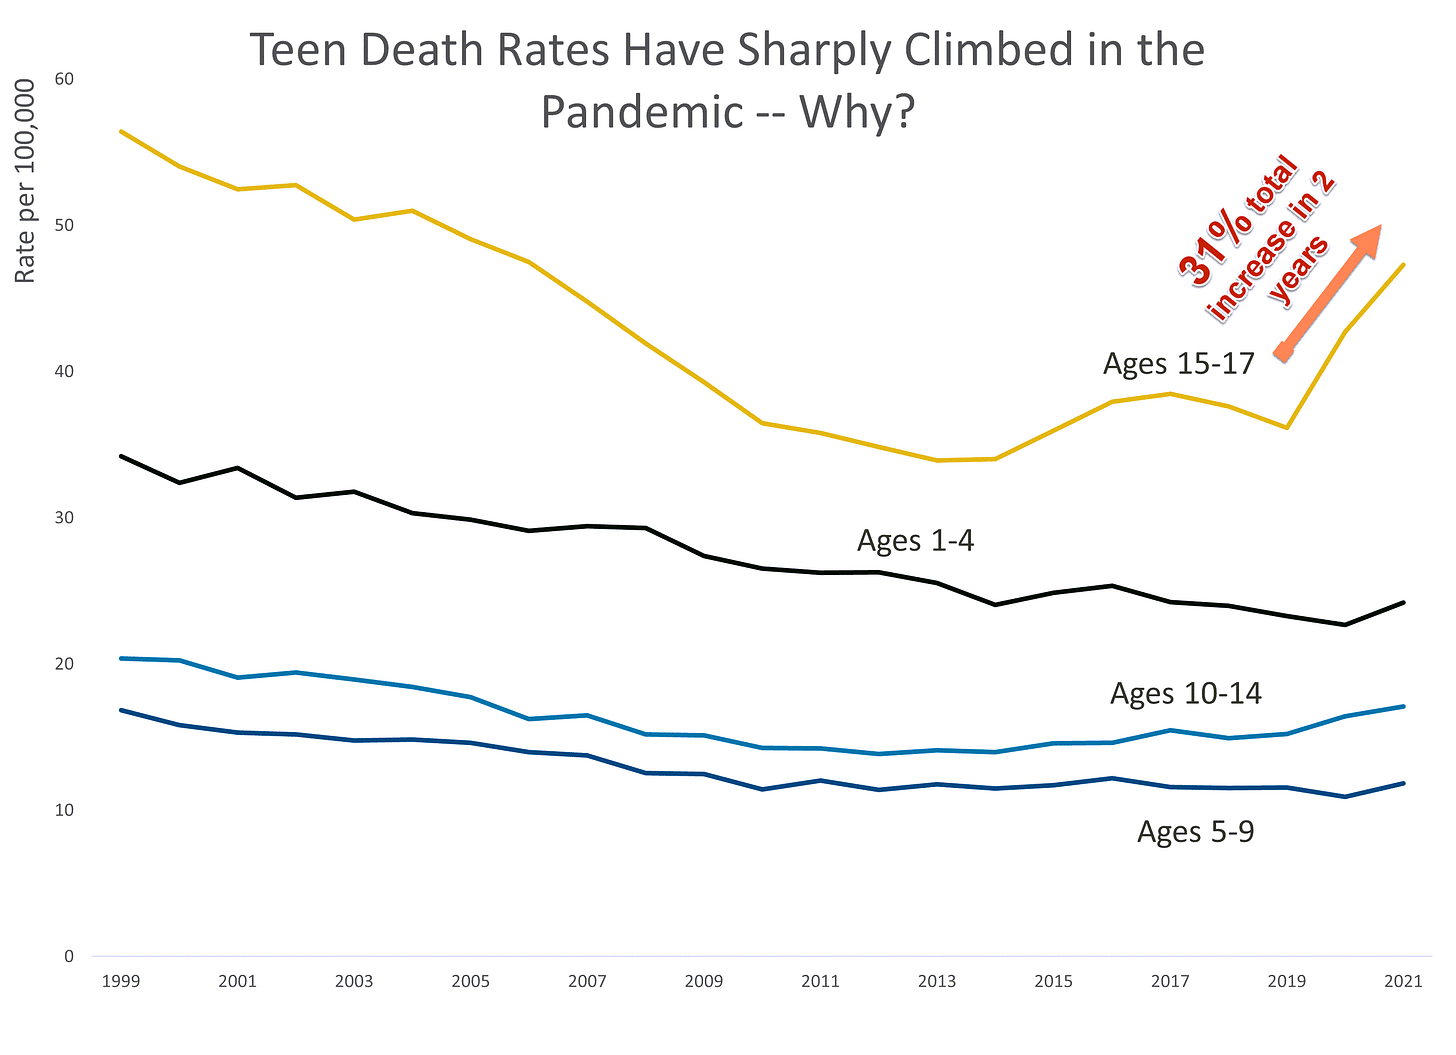
Look at the following graph:
From 2019 to 2021, in provisional statistics, the death rate for those age 15 to 17 increased 31%. That represents an increase in total number of deaths of 1420 deaths (reported so far — 2021 deaths are only provisional, and counts continue to go up, but it’s mostly there.)
For the other pediatric age groups I have there, the death rates have not increased nearly so drastically — age 1-4 death rate increased only 4% from 2019 to 2021, age 5-9 death rate increased 2%, and age 10-14 increased 12%.
While it’s not happy seeing an increase in mortality rates for children, and a 12% increase over two years is definitely not fabulous, these are increases of 91, 63, and 385 deaths for the entire country from 2019 total deaths to 2021 total deaths for the age 1-4, age 5-9, and age 10-14 groups, in that order.
I am concerned about the 1,420 deaths increase for the 15-17-year-olds, which represents a 31% increase in death rates in two years. These were large increases year-over-year for both 2020 and 2021 (so far, of what we have).
Why?
It wasn’t COVID.
Let’s get the very easy question out of the way first: it wasn’t COVID. As of my data pull, there were only 161 COVID deaths for people aged 15-17 reported in 2021 (this is for the underlying cause of death, by the way. All my analyses for this post have to do with what was recorded as the primary cause of death.)
This did not surprise me, just due to how heavily age-dependent COVID deaths have been throughout this pandemic. I have found that COVID deaths are more age-dependent than cancer and heart disease in doing certain comparisons, which I will do in a “geeking out” post another time.
In the meantime, here are the number of COVID deaths by age group for the U.S., that were available in CDC WONDER as of 3 April 2022:
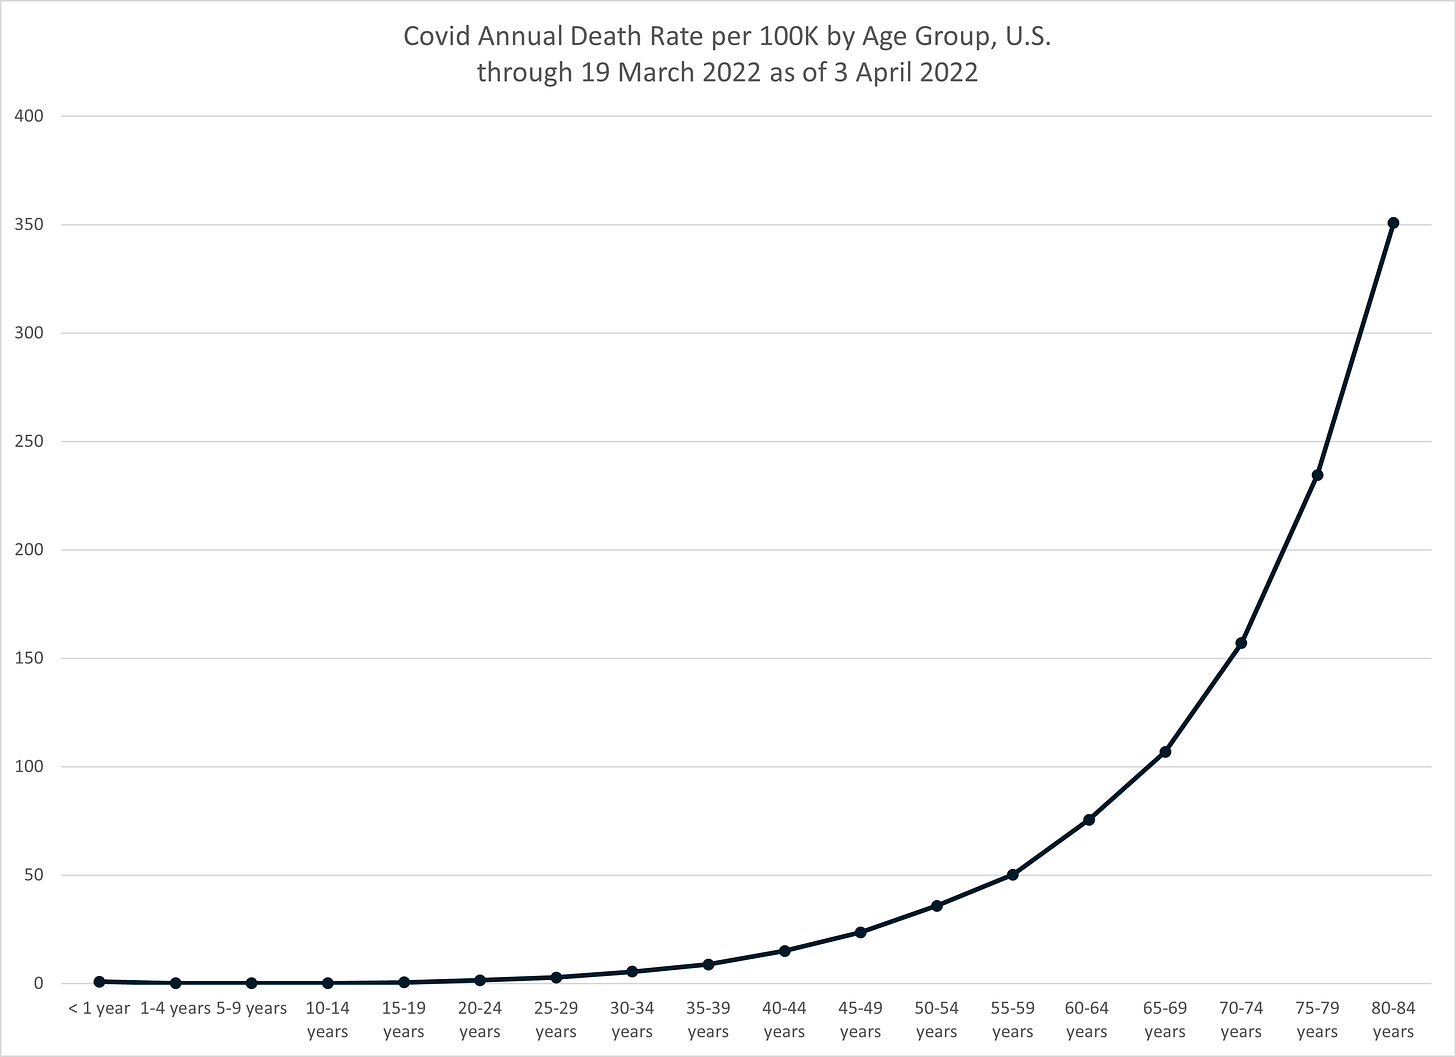
And this is what the curve of the COVID death rates by age look like. This is the unconditional death rate, by the way — this is not conditioned on someone having gotten COVID. That is, just given you’re an American in America in the last couple of years, was was the annual death rate from COVID for your age grouping:
The death rates conditioned on having caught COVID are worse, obviously.
No, you can’t see either the count nor the rate on these graphs, because they are dwarfed by the age effect. You can see the exponential growth in death rates in the second graph, and the first graph shows what happens when those exponential growth rates hit the actual age distribution of the U.S. population in 2019-2021.
It’s mainly external causes
In general, teens don’t have very high death rates, and even with the recent 31% increase, the rates are still under 0.05%, which is a very small number.
Something which should surprise no one, the main driver of the large increase in teen mortality in two years are those nasties I’ve been profiling the last few months, and in particular, homicide and drug overdoses.
Let me do a breakout by very high-level causes:
And yes, I have to put that bar in there for “censored” causes, as that’s the huge driver for teenage mortality. It’s just those very specific nasty causes that are censored, the external causes of death, as they have to investigate intent (was that truly accidental, or was it on purpose?) and it is sensitive in nature. In addition, as I’ve mentioned before, I don’t think some of these external causes of death get into the database as quickly, just for base counts, as do naturally-caused deaths. For one, it may take a while before the body is found…
Because of the censoring of data, I can’t give you results for 2021 for the particular causes of death for these age groups that we want.
I can tell you that the numbers are already pretty alarming from 2020, though.
Homicides increased 46% for ages 15-17 from 2019 to 2020. That was an increase from 718 deaths to 1,048 deaths.
Suicides decreased 2% from 2019 to 2020, from 1,100 to 1,078. That’s essentially statistically no change.
Breakout of accidental deaths
Accidents increased 32% from 2019 to 2020, going from 1,388 up to 1,833.
Accidental deaths encompass a lot of things, especially for teens who do a lot of stupid things (and it’s mainly teenaged boys doing the stupid things).
Motor vehicle accidents were the biggest category here, increasing 22%, from 928 deaths in 2019 to 1128 deaths in 2020.
Drug overdoses, though increased over 100% from 173 deaths to 404 deaths.
To be sure, these are relatively small numbers.
However, most teens are not living independently and are, theoretically at least, under the supervision of older adults. They generally don’t have as many opportunities for really dangerous opportunities as do older adults.
That’s why their increase in mortality was actually not as high as younger adults.
Worse news is coming
So that’s the good news, I guess.
I haven’t really touched on younger children than the 15-17-year-olds, because almost nothing is going on there. The next age group down, age 10-14, did see an uptick in suicide in 2020, but to a level that was below 2018.
If you want a story for little children and mortality it’s this: no, COVID isn’t slaughtering the children. It’s mainly killing old people. It’s still killing old people, albeit it’s doing the springtime slowdown again in the U.S. Just like last year. Huh.
I will be getting to a post as to why mortality for those age 40-44 was so bad, but I think you’re beginning to see why. There are many non-COVID nasties that have had very large increases in the teenage and young adult population, and it peters out somewhere in middle age. Then there are the natural causes that have gotten a mortality boost, and natural causes tend to have a very large age component, as you can see with the COVID mortality curve above.
Age 40-44 is sitting right in the middle of that witches brew of an intersection between external causes and natural causes and getting hit from both sides.
But that’s for a future post.
Methodology
Mortality data were taken from CDC WONDER on 7 April 2022 and 10 April 2022. Data from final underlying cause of death were used for 1999-2020, as well as data from provisional databases for 2021. The provisional data are for deaths reported through 3 April 2022, and occurring up to 19 March 2022. In general, I was looking only at deaths up to the end of calendar year 2021, but for COVID deaths, I included deaths through 19 March 2022 that have been reported.
Causes of death were using ICD-10 groupings for the underlying cause of death from the 113 causes of death list, and chosen as per major causes, not necessarily the rankable causes (as per motor vehicle accidents, which are a subset of accidents (which is a stupid grouping, in my opinion.)) I look solely at underlying cause of death, and do not care about multiple cause/contributing cause of death for this post. (no “with COVID” stuff here.)
Death rates for age groups were calculated by querying for deaths by single-age and single year and the 113 cause list. However, when CDC WONDER suppression was giving trouble, sometimes spot-querying was done to make sure that the aggregated amount was still less than the suppression limit for aggregated group and not just for single ages. Can’t do much when the whole group has a result that’s too low.
The number of deaths involved are rather low for most pediatric groups, but for the causes of death I’m focusing on for the teenagers tends to be larger than that.
The spreadsheet with exported data, along with analysis and graphs, can be downloaded below:


