Video: U.S. Mortality Through the Pandemic, part 2 -- Differences by State
Using tile grid maps to find geographic patterns
Here’s the video:
It includes a data update from the first week of April 2023. The 2022 mortality data is still provisional, so there was some change in the ranking table you see from the March 2023 slides I had.
Graphs from the video: Year-by-year tile grid maps
Time stamps in the video:
02:40 Pre-pandemic mortality 2019
03:53 Pandemic mortality 2020
06:27 Pandemic mortality 2021
07:27 2022 mortality
2019
2020
2021
2022
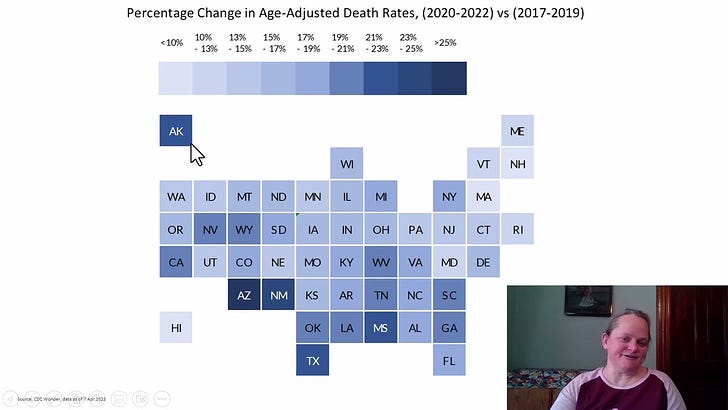
Percentage changes 2017-2019 to 2020-2022 and ranking results
Time stamps:
09:30 Percentage change from pre-pandemic to pandemic
12:45 Ranking table for percentage change - top ten
14:29 Bottom 41 of the ranking table
Full percentage changes
Ranking table
This ranking is in the order of the percentage increase from the average mortality level 2017-2019 to the level 2020-2022.
Slides and spreadsheets
With the new data, I made updates to the files.
Here are the links and actual files for download:
Dropbox folder with slides and spreadsheets: [pick the April 2023 folder]
https://www.dropbox.com/sh/nbqey8kyb3l4mla/AABIHYHzsk4zCi-WMqjJCvJla?dl=0
Slides in PDF:
Spreadsheet:
Enjoy!


