U.S. Mortality in 2023: Initial Updates
Look over my shoulder as I do my initial full-year updates
I would normally wait a few more weeks… but I’m giving a talk in a couple of weeks! I can’t wait!
So let’s get cracking!
Top-level mortality trends
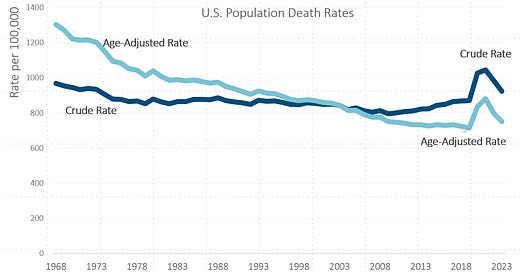
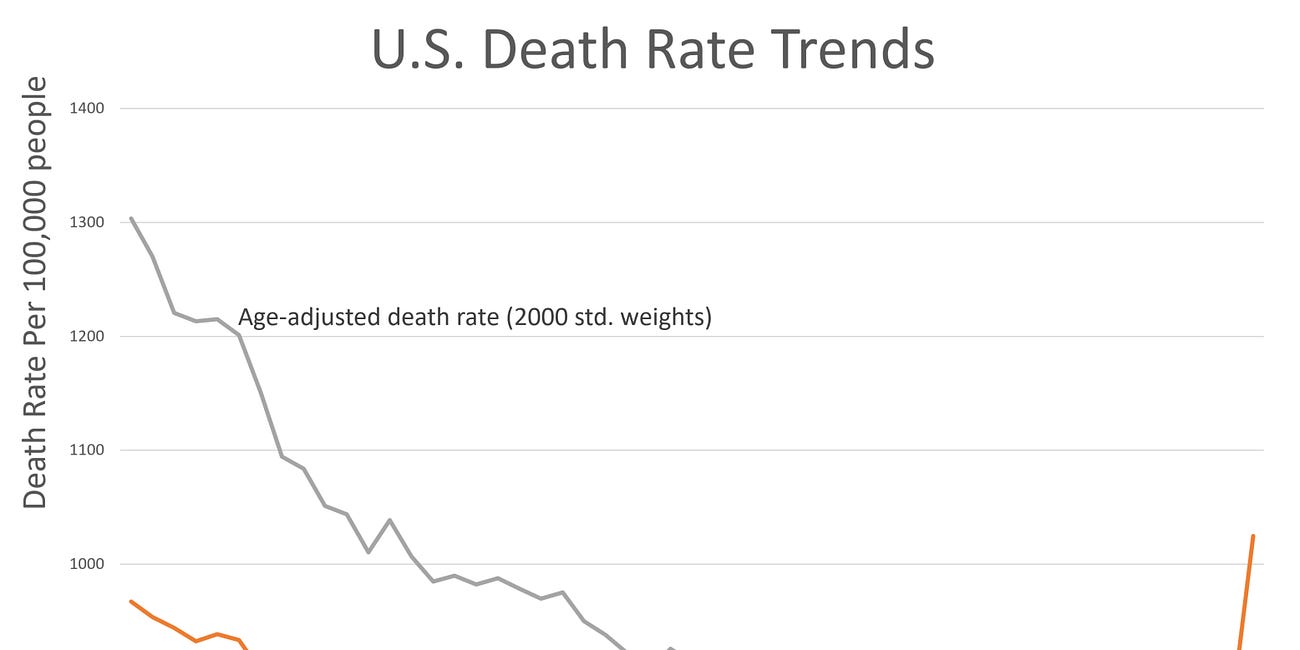
Note the distinction between crude death rate (which is just total deaths divided by total population) and age-adjusted death rate trend.
The crude death rate is fairly sideways as the population was aging from 1968 - 2018, so age-adjusted death rates fix that as explained here:
Mortality Basics with Meep: Age-Adjusted Death Rates v. Crude Death Rates for U.S. 1968-2020
I have been complaining even before 2020 about how media generally talks about mortality trends, generally using life expectancy as their hook. Here are a few posts where I do that: Mortality with Meep: U.S. Life Expectancy Fell 2.4% in 2020, and Death Rates Increased 16.1%
Back to 2009?
We will return to this in a bit.
But on an age-adjusted basis, the death rate for the entire U.S. population in 2023 was back at the level last seen in 2009.
That is about 5% above where it was in 2019, the last pre-pandemic year.
In general, the age-adjusted death rate has improved about 1% per year - so the 17% increase in 2020 had a lot to recover from. Even the large COVID hit in 2021 only increased on top of 2020 by an additional 5%.
The rates came down a lot in 2022 and 2023.
But they didn’t come down to where they were before.
Daily Deaths — Almost Looks Normal
Take a look at the pattern of average daily deaths per month in 2023 and compare to 2018 and 2019.
It does look similar to the seasonal pattern: worst in the winter, lowest in the summer.
However, let’s do an actual head-to-head comparison.
Persistently higher death counts
I’m including the pandemic spikes, so you can see how extreme the COVID death waves were.
However, note the persistently high increase in deaths per month from 2019 to 2023 — it’s 6% to 10% higher.
Even a 6% increase in 4 years is a large increase.
More to come.
Spreadsheet


