U.S. Mortality 2023-2024: Continuing Increased Mortality post-Pandemic
Some previews of my upcoming actuarial talk
I’ve been preparing my slides for the Middle Atlantic Actuarial Club, which is having its Fall 2024 meeting online, November 12th 12:00PM-4:00PM EST and November 13th 8:30AM-1:00PM EST. More information at their page.
Let me share a few of the slides, and some comments.
High-level mortality results
The crude rate is simple to understand: number of deaths divided by total population. However, this does not capture mortality trends well, because it could simply reflect an aging society.
The age-adjusted rate is an attempt to remove the effect of the changing demographics of the society. One makes a weighted average of death rates by age groups.
So if mortality rates are improving broadly by age groups, the age-adjusted rate would reflect that, but the crude rate could worsen due to an aging society.
See this older post for a more in-depth explanation of age-adjusted rates versus crude death rates:
The main thing to note is that the 2023 mortality was still worse than 2019 pre-pandemic mortality.
On a crude rate basis, it’s 6% higher than 2019; on an age-adjusted basis, it’s 5% higher.
On an age-adjusted basis, the 2023 results were about the same level as 2009.
Monthly time series
Keep in mind that it takes time to report deaths, so the deaths reported thus far for July and August 2024 (where I stopped graphing) are probably a bit too low.
When looking on a percentage basis, for 2023 the percentages averaged 8%, which ended up as a 5-6% overall increase in mortality compared to 2019.
For 2024 so far, the percentage increase is 6%. So I’m expecting that 2024 mortality to be at least 4% higher than 2019.
The question is: is mortality going to “glide path” back to “mortality improvement” or will we be seeing mortality “disimprovement” in general?
Age Groups
This is what the death rates look like by age with a regular vertical axis:
Older people die at higher rates. I usually use a logarithmic vertical axis given the natural relationship:
Yes, infant mortality is high. It’s higher than mortality for young and middle-aged adults.
But the situation is that the percentage change in mortality rates differed by age group:
Let us ignore what happened in 2020-2022 (I am de-emphasizing those years, obviously).
Yes, the oldest adults have the highest death rates, but those have increased the least compared to 2019.
Where we’ve seen the greatest “pain points” are among children, young adults, and younger middle-aged adults.
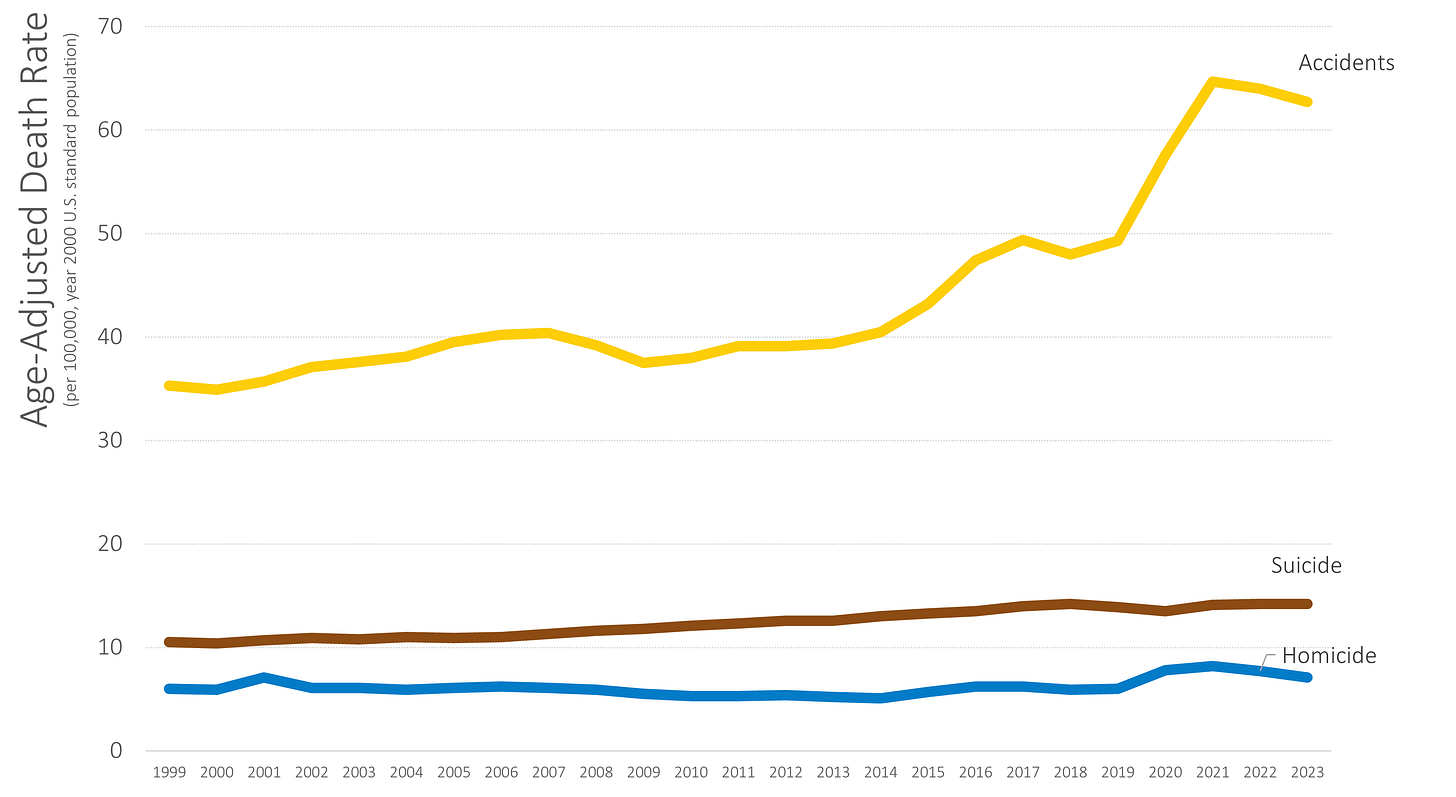
It’s a mix of both natural causes of death and a large amount of external causes of death: suicide, homicide, and accidents (which includes drug overdoses, motor vehicle accident deaths, etc.)
Preview: External Causes of Death
Yeah.
Um.
Been noticing something about your auto insurance premiums?
To be sure, it’s not only about deaths, but deaths are a wee more expensive than fender-benders.
I will write more about the external causes of death in another post.


I thought overdose deaths were going down. The graph of 2023 rates shows otherwise. Did opioid death rates go down but other drug overdoses rise? Are we just seeing a move from one substance to another?
"the oldest adults have the highest death rates, but those have increased the least compared to 2019."
I struggle with this. When would/should we expect it to go down (if ever), and to what extent is this necessarily going impacted by a growing elderly population?