Suicide: Trends 1999-2022 (provisional) by Sex and Race/Ethnicity
These are not good trends
Earlier today I saw the following tweet:
I had been planning to do something for Men’s Health Month, given my interest with Movember. I will share some prior posts at the bottom of this one.
I did a Twitter thread on the linked report, but I want to redo some of the graphs, and I’m extending it to 2022. However, a caveat: there are no data for December 2022 yet, so the rates are a little low.
High-level result: suicide rates have been increasing
Just focusing on the 1999-2022 period, even missing the December 2022 data, we have increasing rates.
However, let us focus on the 1999-2021 period, as the data for 2021 are complete.
Age-adjusted death rates by suicide increased 28% for males from 1999 to 2021.
They’ve increased 43% for females.
To be sure, even with that 43% increase in suicide rates for women, the ratio between male and female death rates by suicide is about 4x. We will see that more starkly in a moment.
Breakout by race/ethnicity: females
Let’s look at the trajectories for major racial/ethnic groups in the U.S.
To simplify the statistics (and as groups with too small data sets will get me no rates for some years, due to insufficiency), I have five groups, which are defined to be non-overlapping. Hispanic (any race), White, Black, Asian, American Indian or Alaska Native.
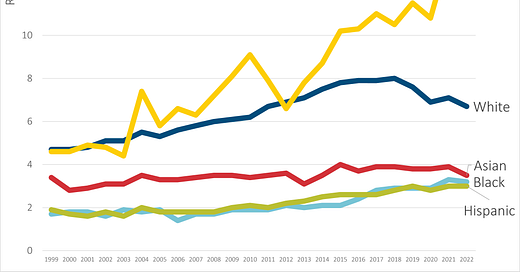
Here is the graph for females.
As it is hard to ignore, the American Indian and Alaska Native (AIAN) trend is horrendous. That is an increase of 200% over the period, and the thing is, I know this isn’t the only cause of death with horrible trends for this group.
The Asian trend shows the least growth, with only 15% increase from 1999 to 2021.
Blacks and Hispanics show similar trends overall, though their percentage increases differ — 94% increase for Black women and 58% increase for Hispanic women.
White women have seen a 51% increase in rates.
These are all very large increases, even over two decades.
That said, look at the scale: the top rate for AIAN is still under 14 per 100,000 people per year. White females were at about 8 at maximum. Those are the top two. Remember those numbers.
Breakout by race/ethnicity: males
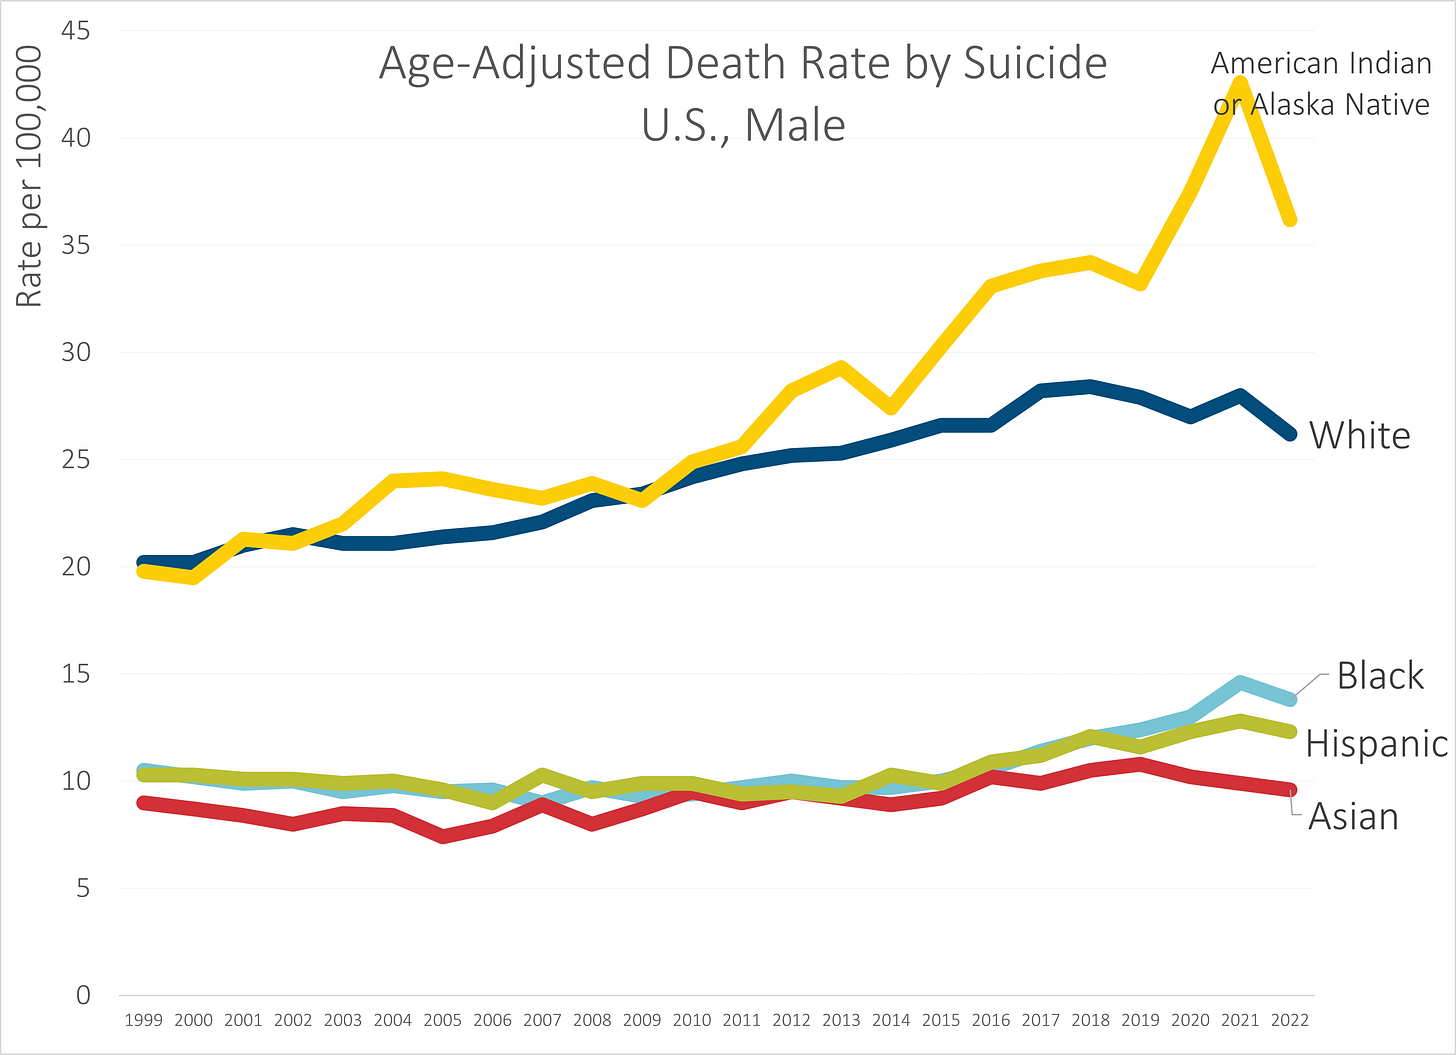
On the vertical scale, 14 is above where Black, Hispanic, and Asian males fall for the entirety of 1999-2022. The 8 level is just below where they are.
The two highest groups, again, are White and AIAN. And they are well higher than the others.
As for increases over the period… oh man. AIAN male suicide rates increased 115% from 1999 to 2021.
This is hideous.
You may find it interesting that the White male suicide rate is about 2x that of Black males. Both of them increased 39% from 1999 to 2021.
As with Asian females, Asian males have the lowest suicide rates, and their rates increased only 10%.
The Hispanic male rate increase was somewhat in the middle, increasing 24%.
Can we counteract these trends?
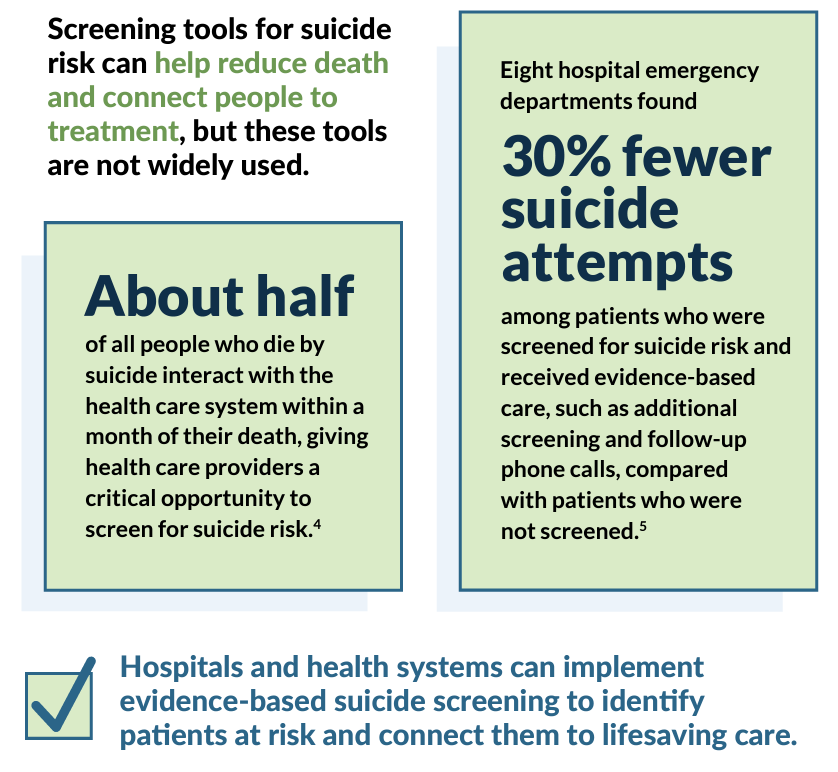
As you may (or may not) know, I grab sources for future use (or not) on Actuarial News. Last week, I caught a piece from Pew Trusts on preventing suicide:
The thing is, this is based on a paper from 2014 based on experience from 2000-2010 and a paper from 2017 based on 8 Emergency Departments on periods covering time from 2010 to 2013.
I’m saying… I would like there to be effective interventions, and I’m not saying don’t try.
I’m just saying… this is not clear to me.
Spreadsheet
Related Posts
January 2022: Suicide: Trends, 1968-2020, and Provisional Counts Through June 2021
Sept 2022: World Suicide Prevention Day: U.S. Suicide Trend Update through 2021
Nov 2022: Movember 2022: The Sex Gap in Suicide


It appears that Hispanic women are the happiest group on the planet?