RIP, Rep. Sheila Jackson Lee: An Update on Pancreatic Cancer Death Trends
A further split out by demographics and trends
A late-night announcement yesterday:
The Hill: Rep. Sheila Jackson Lee dead at 74
We first heard about her fight with pancreatic cancer in June, in a report dated June 3, 2024.
That her death followed so quickly after the announcement of the cancer, especially for pancreatic cancer, did not surprise me.
Survivorship curves for pancreatic cancer
I have two different sources for data:
American Cancer Society page on pancreatic cancer survivorship, using data for pancreatic cancer patients diagnosed between 2013 and 2019, last updated February 2024.
Cancer Research UK page, using patients diagnosed between 2012 and 2014, last reviewed February 2023.
Definitions:
Localized: There is no sign that the cancer has spread outside of the pancreas.
Regional: The cancer has spread from the pancreas to nearby structures or lymph nodes.
Distant: The cancer has spread to distant parts of the body, such as the lungs, liver, or bones.
Here is the survivorship table using those sources:
No, these are not consistent, because these are different sources, covering different time periods and different populations.
The UK sources aren’t even UK- or England-only populations. For the 1- and 3-year stage-specific survival rates, they had data from: Australia, Canada, Denmark, Ireland, New Zealand, Norway, and the UK (and they excluded Scotland, because they couldn’t get stage data, apparently.)
Either way, pancreatic cancer does not have a great survival rate, however you look at it, given most of the cancer one hears about, such as breast or prostate cancer, if they are localized, have not only near-100% 5-year survival rates, they are actually curable.
Deeper dive into pancreatic cancer mortality trends
Here is my prior post on pancreatic cancer, when Rep. Lee’s diagnosis was made public:
Pancreatic Cancer Trends: 1999-2023, U.S.
This hasn’t made as big a news splash because of all the other things going on (also, scanty details), but I noticed Sheila Jackson Lee announced a diagnosis of pancreatic cancer: AP: Rep. Sheila Jackson Lee, a Texas Democrat, says she has pancreatic cancer
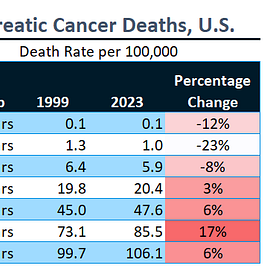
Again, let us look at high level results before I dig into more detail:
Don’t overinterpret the movement for the under-age-45 groups. Those are very low rates to begin with.
That said, there are notable increases in death rates at older ages.
While we see increases in rates for both sexes, and for non-Hispanic Whites and Hispanics (of any race), I want to note the mortality gaps.
For example, while there has been some decrease in the age-adjusted death rates due to pancreatic cancer for non-Hispanic Black people in the U.S. for 1999-2023, it is still a high rate compared to other racial/ethnic groups.
Given what I know about how these weighted averages can change, and how Simpson’s Paradox can confound trends, I will disaggregate by both sex and race/ethnicity first, then let us see what we can do by age group.
Race/sex trends in pancreatic cancer mortality in the U.S. 1999-2023
So that we can compare the groupings, I use the same vertical axes in both graphs.
Males
Females
You may be asking about racial/ethnic groupings I did not include here. (and why “Hispanic White”?)
Specifically, I tried to pick groups that had sufficient size and number of pancreatic cancer deaths that I had data for each year. Many race/ethnic groupings did not have sufficient numbers.
You will notice there is a lot more volatility in the trends for all the lines except the non-Hispanic White groupings. That’s because there are over 15,000 pancreatic cancer deaths per year represented in those lines.
In contrast, the next largest group in population, Hispanic White, has only over 1,500 deaths per year.
Non-Hispanic Black is a smaller group in population, but more pancreatic cancer deaths. It’s still only a few thousand per year. It takes a lot of deaths to generate a nice, smooth trend.
When we break out sex and race/ethnicity, it looks like any decrease I saw among non-Hispanic Blacks in age-adjusted death rates originally came from males, and that decrease looks like it came on early in the period.
Both Black women and Asian women saw almost no change in pancreatic cancer age-adjusted death rates over the period. Black men saw a 9% decrease in age-adjusted death rates from 1999 to 2023.
In general, both non-Hispanic and Hispanic Whites, males and females, saw increases in age-adjusted death rates due to pancreatic cancer. This is interesting — these two groups are in the middle of these graphs, and moving upwards, while the two groups at the maximum and minimum extremes are not affected by those trends.


Relatively young. The big C again. RIP.
Thanks for the deep backgound. There is not much progress on this particular cancer.