Revisualizing the Financial State of the States: 2024 Edition
Choices continue to have consequences - including bailouts
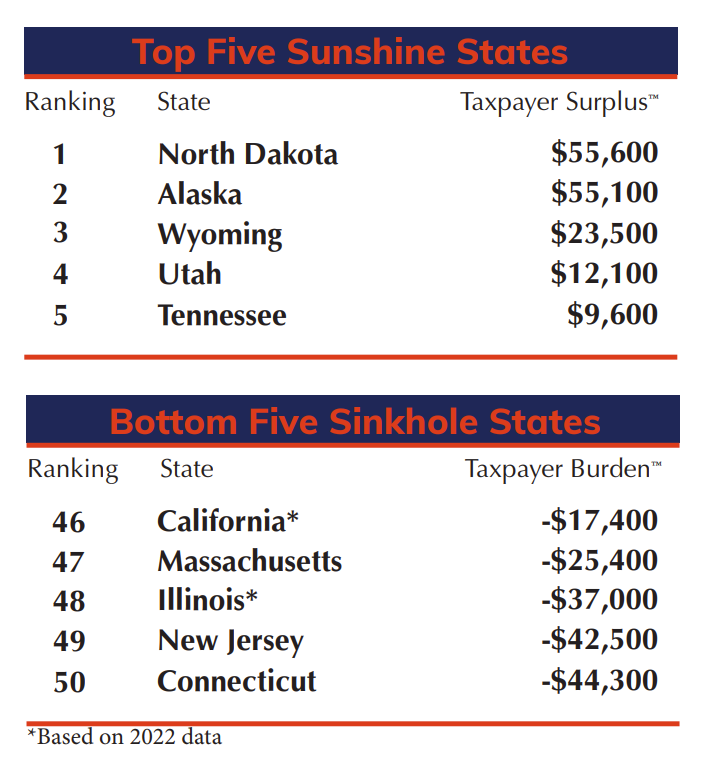
Truth in Accounting has released their 15th annual look at the Financial State of the States.
They have their own way of presenting results:
Get me the statements on time
Note that for most of the states, they used fiscal year 2023 results, but because Illinois and California are so tardy, they had to use FY2022 data for those. Indeed, 6 states were late: [August 31, 2024 was over a year after the end of FY2023 for most states, as FY2023 ended June 30, 2023 for most states]
Here are the most timely states:
A More Readable Map: the Tile Grid Map
Longtime readers of STUMP will know that I am fond of the tile grid map visualization.
Here is a tile grid map revisualization of the 2024 State of the States:
Remember that red is BAD and black is good in accounting parlance. The field of grey is just a little good.
Let’s compare this to the last time I revisualized the State of the States in the 2021 report:
That was pre-bailout, and post-COVID, so there’s a LOT more red.
Slope Line Graph For Comparison
The tile grid map is discrete and shows major categories, but doesn’t show finer distinctions.
As noted, the 2021 report captures the pre-federal bailout, and this 2024 report has the effect (salutary or not) of the federal largesse for the states. Let's take a look of who really took advantage.
Let’s start with the 10 best states.
Alaska was fairly level, but in general, these best states had started out in surplus positions and improved upon them.
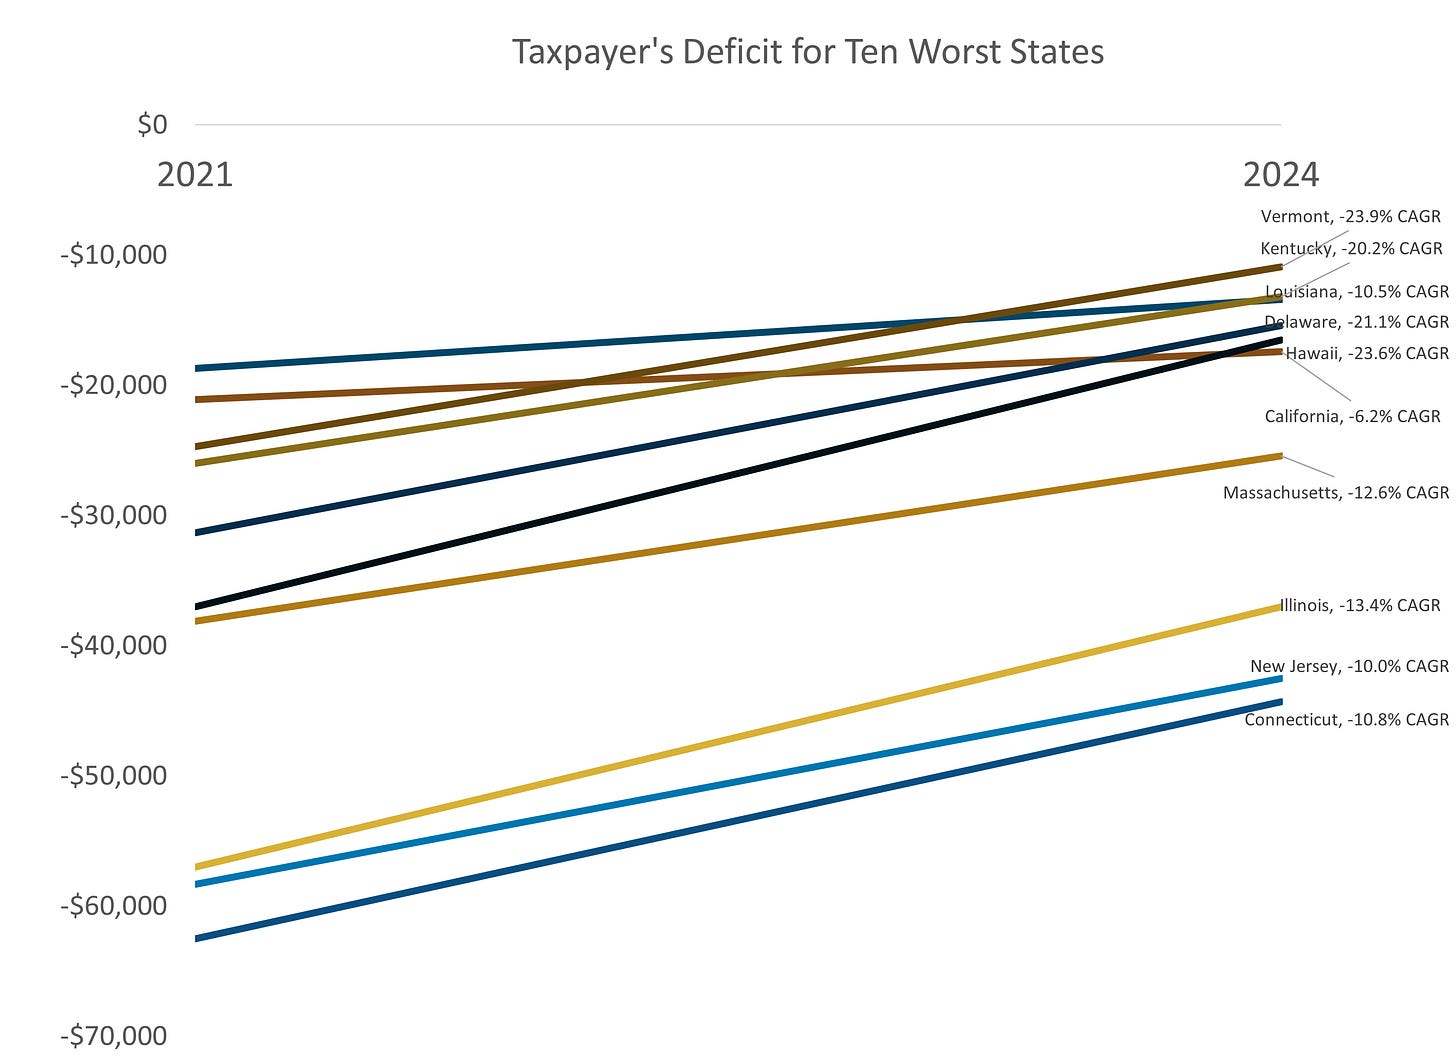
How about the 10 worst states?
It’s a little difficult to interpret growth rates (CAGR = compound annual growth rates) on negative numbers, but it is interesting to see that these states deep in the hole also managed to improve their lot.
However, some improved their lot more than others, with some like Hawaii digging out of their hole much more rapidly — a much more negative number means a steeper climb toward solvency.
California, however, was fairly tardy, with only a -6.2% CAGR… but remember, California was one of the few states with late numbers, so the full impact of the federal bailout bucks aren’t there yet. That may be why they’re “underperforming”.
Spreadsheet
Prior Posts
June 2023: Public Finance Spotlight: Truth in Accounting
Sept 2021: Revisualizing the Financial State of the States: 2021 edition
May 2020: Classic STUMP: Visualizing the Financial State of the States


My state (MA) is one of the worst, despite being required to have a balanced budget. That trend line looks good, but I expect worse next year. We have had a large influx of immigrants, who need housing and other supirt. PE firms have sucked the life out of several hospital systems, which will further burden those that remain. And we have a Governor and legislators who don't understand financial concepts well enough to stop voting for new (ongoing) benefits to be paid instead of "rainy day fund" contributions. I wish I had a solution.