Revisiting Death by Falls: Characteristics
Pre-pandemic, during pandemic, and more
Birthday festivities being over (kind of) yesterday, I decided to take a walk around Bushnell Park in Hartford.
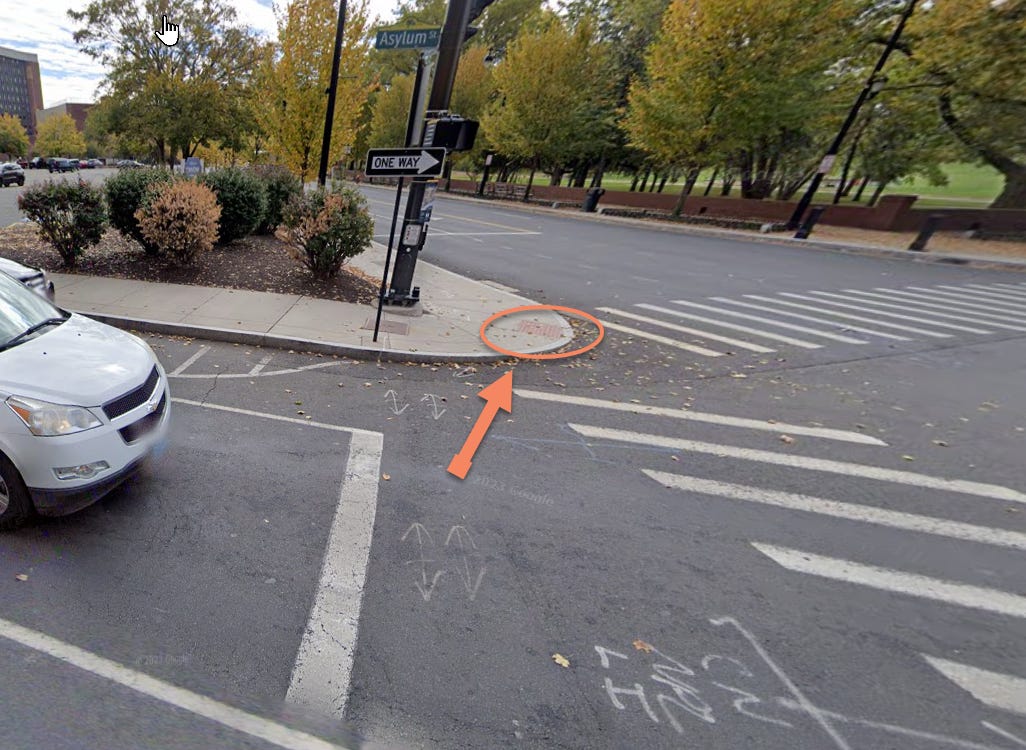
And then I came to this intersection:
Look at that pathetic curb cut. Well, I wasn’t looking down as I walked, was wearing my progressive lens glasses (insert joke here), and didn’t lift my feet sufficiently… so I took a spill. I skinned my left knee, sprained my right hand/wrist, and got the idea to revisit the problem of falls as a cause of death.
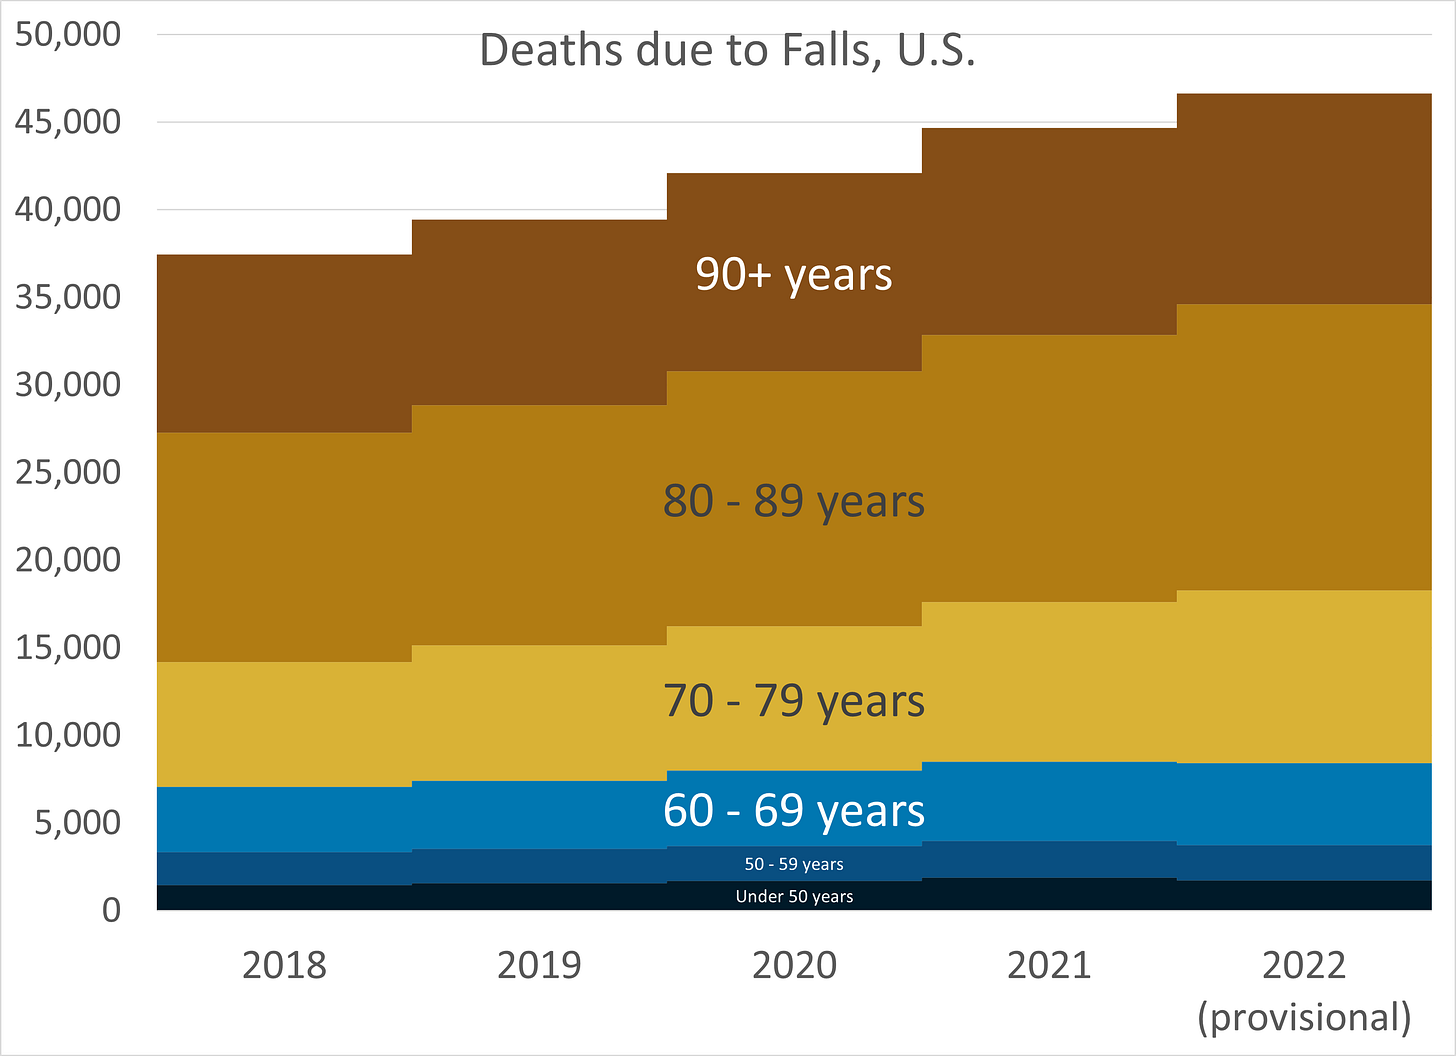
Falls are a major accidental cause of death for seniors
Two prior posts on this issue:
July 2022: The Death of Ivana Trump: Falls are Dangerous for Seniors
March 2024: RIP Joe Lieberman -- A Reminder that Falls are Dangerous to Seniors
There are more aspects than just counts and rates, though, that are available through the CDC WONDER system. Let me explore some of that now.
Types of Falls
I’m keeping things simple, so no spreadsheet, and I’m just sharing the screenshots from the 1999-2020 CDC Wonder queries. Falls are W00 - W19 in ICD-10 codes, but let’s see how that added up for those 21 years:
It does get annoying when one gets the “detailed” ICD-10 cause of death info, and all you get is “unspecified”.
Somebody died here! Can you tell me if they died by falling from scaffolding?!
Now, I didn’t die, but these ICD codes are also used to record causes of injuries. I clearly was a W01 — fall on same level from slipping, tripping, and stumbling. I merely splayed out on the ground, and if my bones were brittle, it could have gone poorly for me. As it is, with icing & ibuprofen, it’s healing fine.
But notice that if we ignore the “unpecified”, the top cause of death by fall is W18, “other fall on same level” - so they didn’t slip, trip, or stumble. They just fell.
W18 - Death by falling on the same level - Age distribution
The oldest age group has a count and a rate of deaths due to falls “on the same level” — not from slipping, tripping, or stumbling — far beyond all the other age groups.
Think about how much this pattern looks like a natural cause of death compared to other accidental causes of death. Drug overdose death rates peak somewhere in middle age. Motor vehicle accident death rates… well, that’s a strange one, but it certainly doesn’t look like that.
W10 — Fall on and from stairs and steps — age distribution
You’re going to notice a theme. The pattern is generally similar.
Here, the number of deaths was highest for the 75-84 year-old age group. But the rate was highest for 85+ years old.
I can do this sort of age distribution for only so many of these detailed causes of death, because when the number of deaths fall below 10, the database system will not report it. I aggregated 21 years of data to get at least 10 deaths even for low-rate situations.
W06 - Fall involving a bed
It keeps going like this.
I kept digging through the types of falls, but they all had the same pattern of increasing rates of death… until I got to fall from a ladder.
W11 — fall on and from a ladder
But this isn’t all that different. The peak rate is for the age group 75-84 years old.
Those over age 85 are probably not getting up on ladders too much.
Other ones:
W14 - Fall from tree
W15 - Fall from cliff
W09 - Playground equipment
Deaths due to falls are mainly a measure of frailty
While some of the death rates are affected by the percentage involved in particular activities (namely: the playground equipment and hanging around in trees or climbing cliffs), almost all show the same pattern of increasing rates with increasing age.
Older people may not be getting up on ladders as often as younger people, but if they do, they may be more likely to fall… and if they fall, they are more likely to get injured. If they’re more likely to get injured, it’s more likely to be serious.
The fall on the curb I had would have shattered the bone of an older person or perhaps had more serious repercussions. I didn’t even get a bruise (though I did get some extra pain).
Other accidental causes of death have different age patterns.
But as I noted with respect to motor vehicle accident deaths in the pandemic, one of the reasons that those age 85+ had higher motor vehicle accident death rates pre-pandemic than younger adults was that they were less likely to survive even low-impact crashes. Their death rates improved in 2020 and 2021, because they simply didn’t leave their homes.
Alas, when it comes to falls…
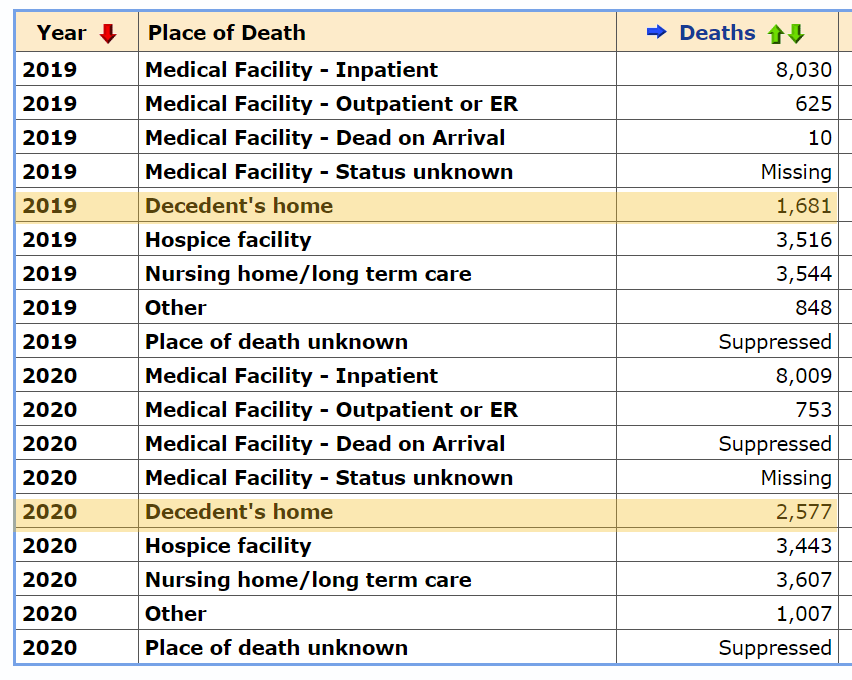
Location of death, 2019-2020, for falls, age 85+
I added the highlights below.
Um, yeah. That was somewhat disturbing.
While falls in other locations changed somewhat, there was a large increase in deaths due to falls at home for the oldest age group - an over 50% increase.
Of course, so many other causes of death with much higher numbers, that it went mostly unremarked.
Adjust to the risks that exist, not how you’d like it to be
I usually don’t tease out these details, and in this case, I didn’t do fancy graphs or have spreadsheets. I just kept it in the screenshots.
Falls have had a bad trend, as noted at the top, with the increasing death rates for seniors for decades. Some can be a result of seniors not dying from other causes — if you don’t die of heart disease or cancer, say, you live to be older and frailer in a house not necessarily designed to deal with the reality of one’s needs.
People need to take these hazards seriously as they do with baby-proofing homes.
Also, Hartford, look at that one-sided curb cut. There are two crosswalks and you made a curb cut for only one of those crosswalks.


