Old Politicians: Trump v. Biden v. Clinton
A little amusing probability calculation to pass the time
Somebody asked me to calculate the likelihood that at least one of Trump, Biden, or (Hillary) Clinton wouldn’t run in 2024…. because they’d be dead.
Now, there are so many assumptions that have to go into such a calculation, and I could throw in so many caveats (which I’m not going to bother with, frankly – just assume I made the caveats, such as “this is not an actuarial opinion, don’t rely on it, yadda yadda” – I need not insult your intelligence), but I decided to do three things instead:
1. I will do a very simplistic calculation and show how it’s done.
2. I will do a spreadsheet, and you can download the spreadsheet and change the assumptions to make your own calculations.
3. I will calculate something else entirely, which is far more fun — what does the joint distribution of the deaths look like?
(Okay, maybe that’s not so much fun, but it will make pretty pictures)
Probability that at least one will die in the next two years
Here are the simplifying assumptions I will make:
1. I will be using the Social Security 2019 life tables, with no mortality improvement.
2. I will be using the following ages for the people:
a. Biden: 79 years
b. Trump: 75 years
c. Clinton: 74 years
3. I assume the event of their deaths would be independent.
4. I am calculating the probability they will die within 2 years.
As with many of these problems, it’s easier to calculate directly the probability all three will survive the next two years.
Let me show how that works using the life table.
For Biden, male age 79, we look at the “number of lives” columns — for age 79, there’s 54,059 in the table… and for age 81, there’s 48,423 in the table. So the survival probability is 48423/54059 = 0.8957 (conversely, the probability that Biden dies sometime in that two-year period is 1 – 48423/54059 = .1043, aka 10.43%). So there’s an 89.57% chance of survival for Biden.
For Trump, male age 75, doing the same thing, we get a 92.85% chance of survival.
For Clinton, female age 74, a 95.48% chance of survival.
To get the probability all of them survive (and we’re assuming independence), we just multiply these probabilities together.
We get a resulting 79.4% probability that all three survive.
The probability that at least one of them doesn’t survive is 1 – the probability they all survive.
So, the probability that at least one doesn’t survive the next two years is 20.6%.
That meme doesn’t really work for this situation, but yeah, I’m using it anyway.
Do your own scenario!
Maybe you’re unhappy with the way I did that.
Maybe you’d like your own assumptions — worry not, have I got a spreadsheet for you! With graph!
(The spreadsheet also has my other calculations in it)
Here’s a screenshot with inputs other than the ones you see above:
For that particular result, you see that the probability of all three surviving is 66%, with the probability of only Biden dying being 17% (I really ratcheted down his survival probability as an example). Only Trump dying is an 8% possibility with that set of assumptions. Etc.
So play with it! Go wild!
Spreadsheet embedded below:
Joint distributions
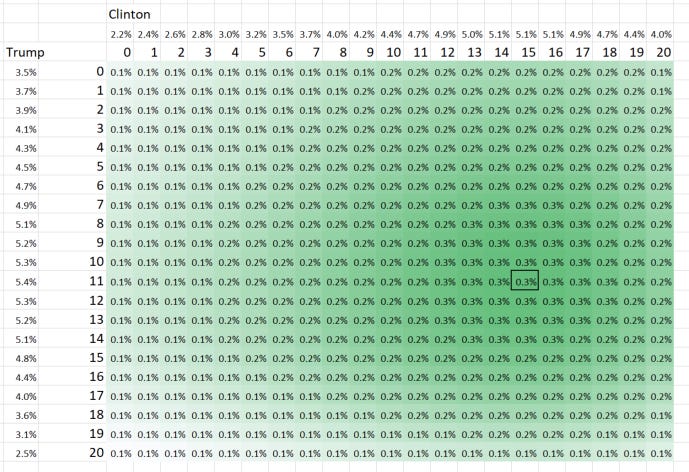
This one isn’t really that involved, other than to show you what you can do with conditional formatting in Excel. When one assumes deaths are independent, the joint distribution of deaths aren’t that interesting…. but here, I calculated out the death curves for all three people (just at discrete time steps), so the probability at time 0 is the probability of dying between now and 1 year from now. The probability at 1 is the probability of dying between one year from now (2022) and two years from now (2023). Etc.
This is using the SSA 2019 Life Tables.
For each candidate pairing, I did a grid, and then put a border around the box with the peak probability. Just so you could see it.
Here is a shot of the Biden-Trump Grid:
So, you see a box around a square where for Trump the peak is at 11 (so his “peak death year” is between 2021+11 and 2021+12 — i.e., 2032 and 2033) and for Biden the peak is at 7 (between 2028 and 2029). This is hardly surprising as Biden is 4 years older than Trump.
If we look at the Trump-Clinton Grid:
You see that Clinton’s peak is 15 years out, but she’s only one year younger than Trump. Instead of that one year adding only about one year to when the peak probability of death is, she gets 4 extra years… because she’s female. So now you see the power of the Sex Gap!
Anyway, this is the kind of thing that makes me happy.
Enjoy the spreadsheet!


