Motor Vehicle Accident Deaths, Part 2: Age-Related Trends with Provisional Results in 2021
Before the pandemic, the worst death rates were for the oldest people
Yesterday, I asked which of four age groups had the highest death rates from motor vehicle accidents in the U.S. in 2019 and 2020. (These also happen to have the highest rates among all the specific age groups I’m using in the analyses below)
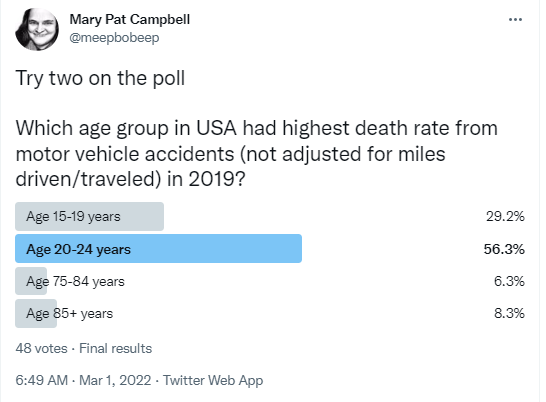
Here are the poll results from yesterday (pictures, because I don’t trust the tweets to embed correctly):
Now, these guesses aren’t bad, given I dropped links to my polls in places where there are mainly actuaries (and it’s a lot of actuaries who follow me/interact with me). If nothing else, everybody knows who gets charged the highest auto insurance premiums.
To be sure, that’s charged on the driver usually causing the accidents, not necessarily the people dying in the accidents. But given most motor vehicle accident fatalities are in single-vehicle accidents, and it’s usually the driver dying, well, not bad guesses.
So let’s see the answers.
The answers to the polls
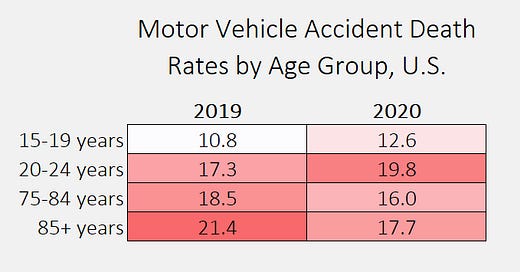
I will be putting these answers in larger context below, but just these four groups for the two years:
The rates are per 100,000 people for the year, but the point is who has the highest, and we see that the answer is:
For 2019: age 85+
For 2020: age 20-24
I threw in the age 15-19 group as ringers, by the way. When we get to all the age groups, they’re not even #4 in the ranking.
As noted in my polling question, I’m not adjusting for the number of miles driven, and I’m not going to dig for that data now. But would you like to make some assumptions about the driving habits of these different groups? Especially during the pandemic?
Just in that little table, you can see that the rates went up for the youngsters and dropped for the seniors. Think about why that might be.
For the rest of the post, we’ll look at all the age groups, and various factors will influence it.
Overall pandemic change from 2019 to 2020: uneven by age groups
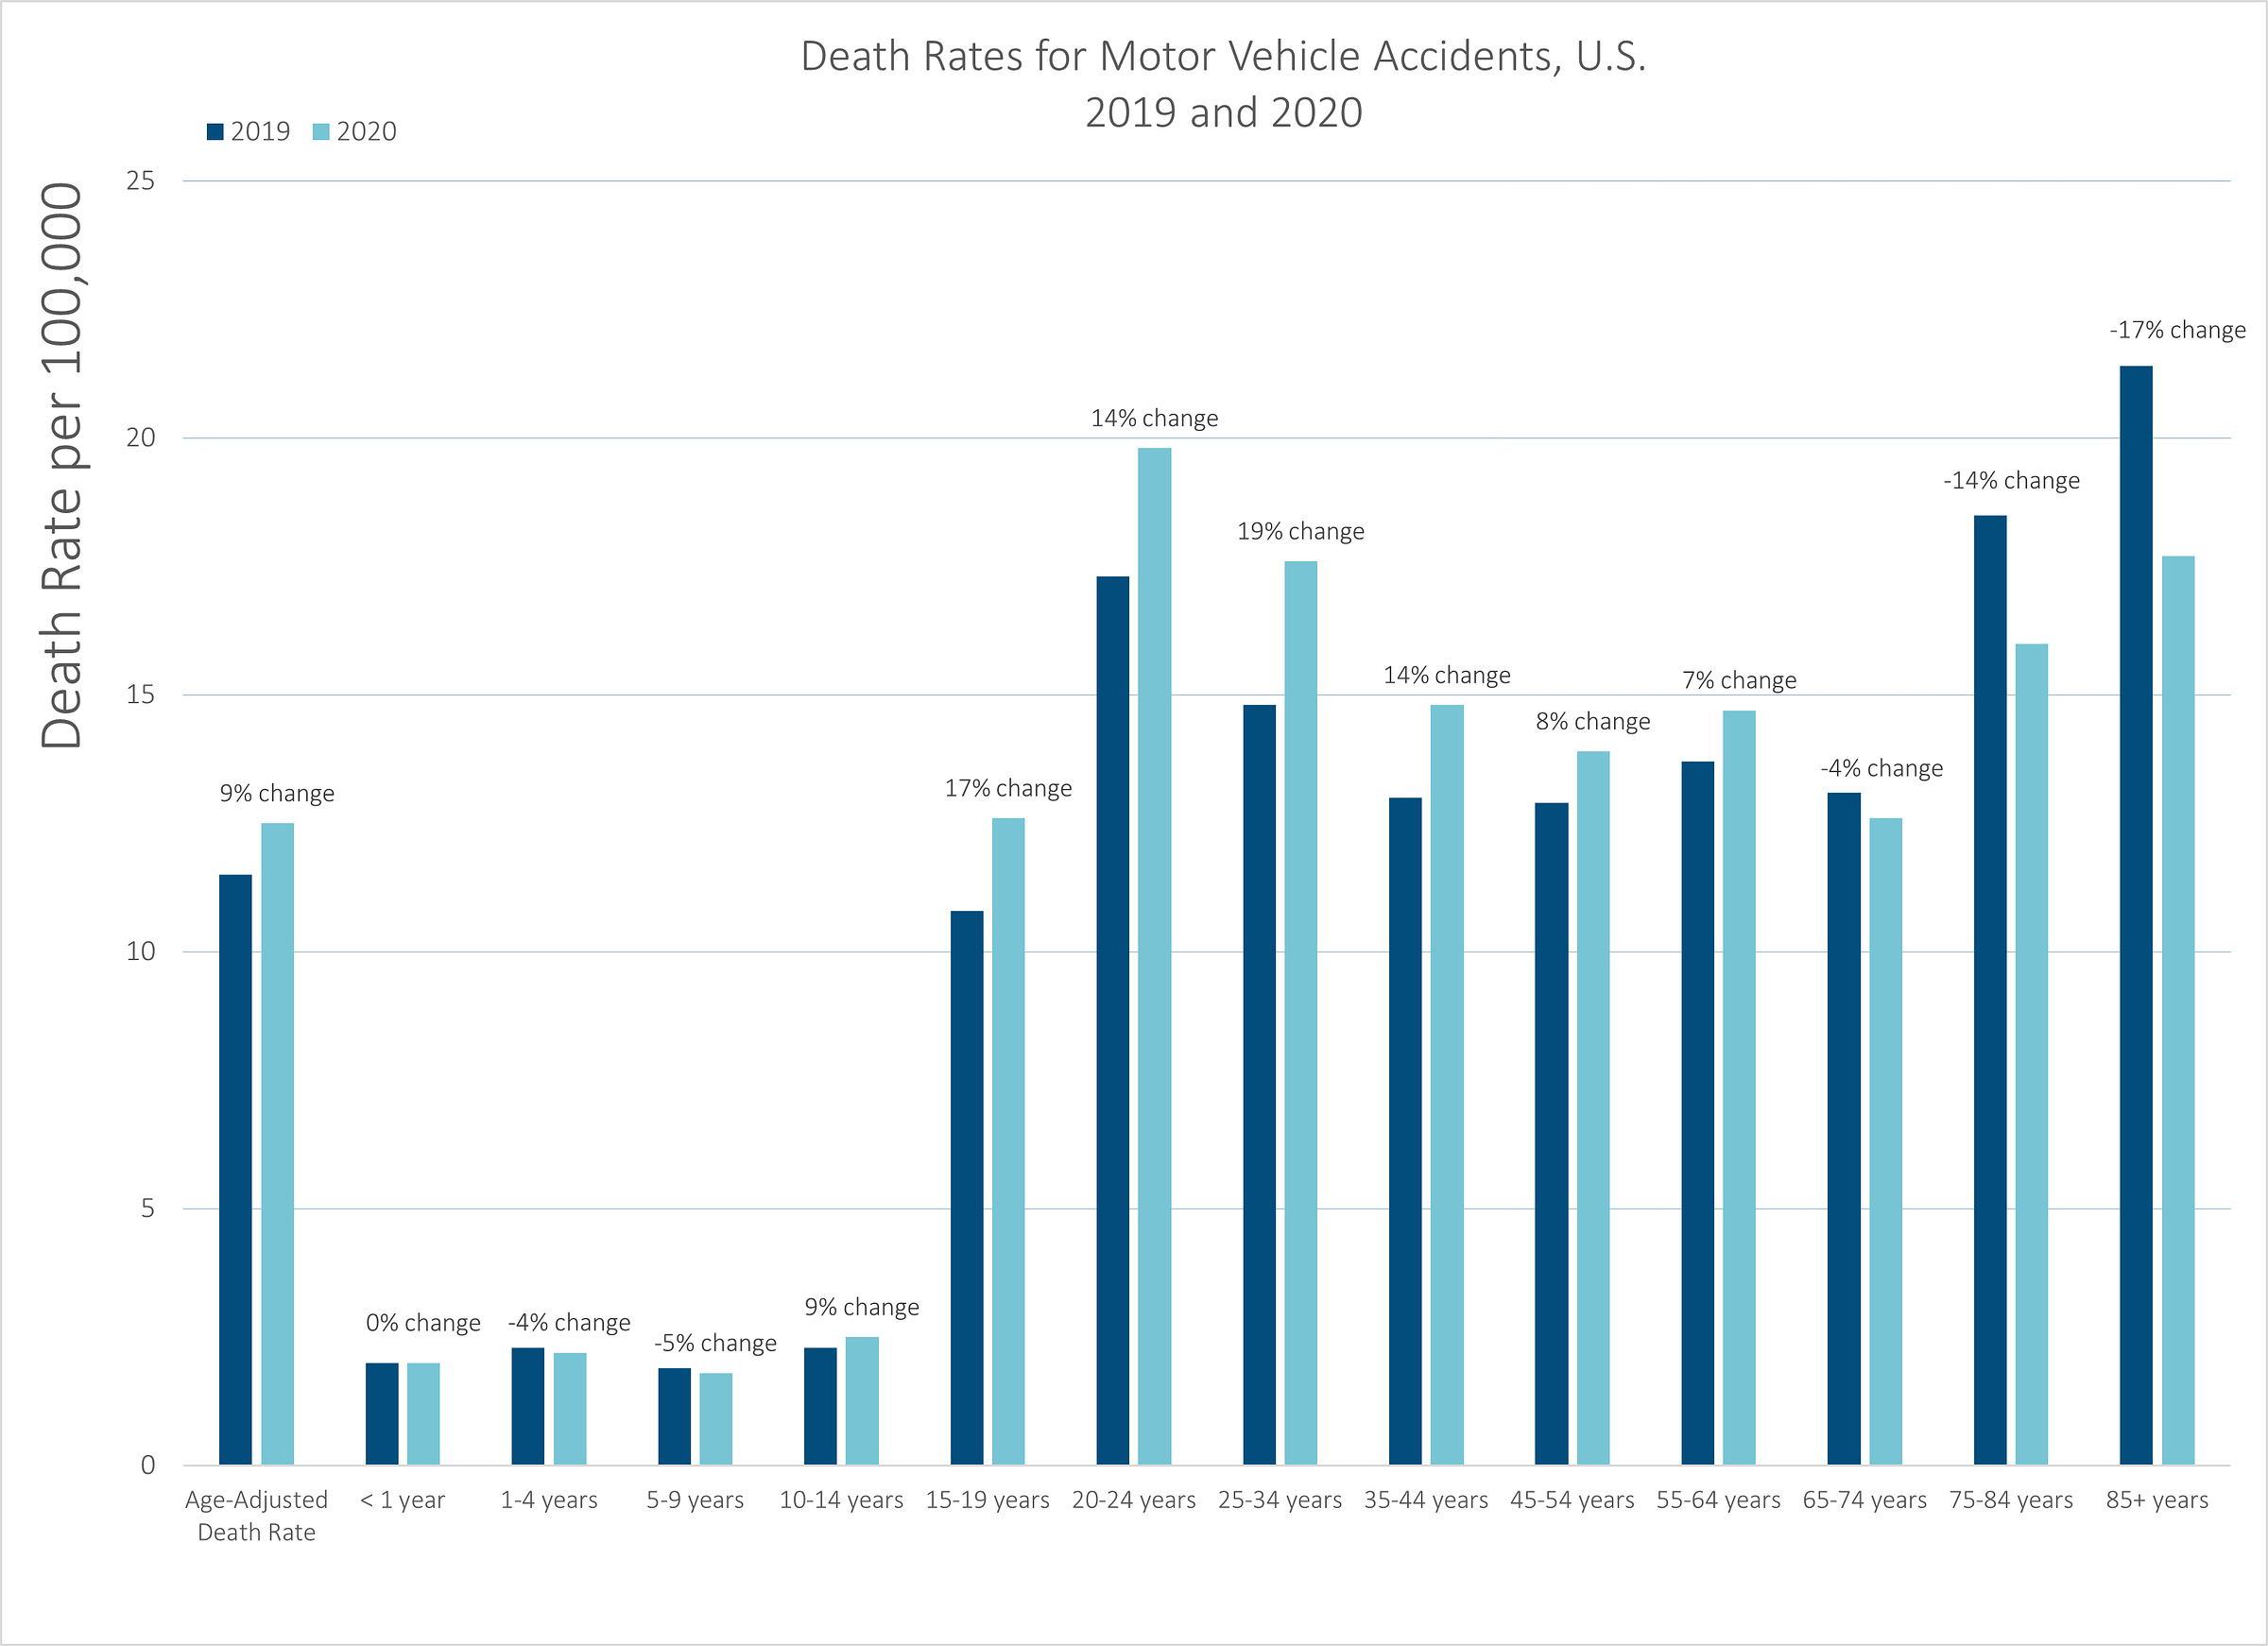
Let me give you the snapshot rather than show the long-term change first. As I mentioned in yesterday’s post, overall the death rate for crashes went up 9%.
But it wasn’t even over all age groups:
It went down a lot for the oldest groups, and down a little for kids.
For teens and young adults, the death rates went up a lot. For ages 15-44, there were double-digit percentage increases.
Remember how I said adults under age 44 saw relative mortality increases much more significant than other age groups? And how a lot of that wasn’t COVID?
Motor vehicle accidents were one of the prominent contributors.
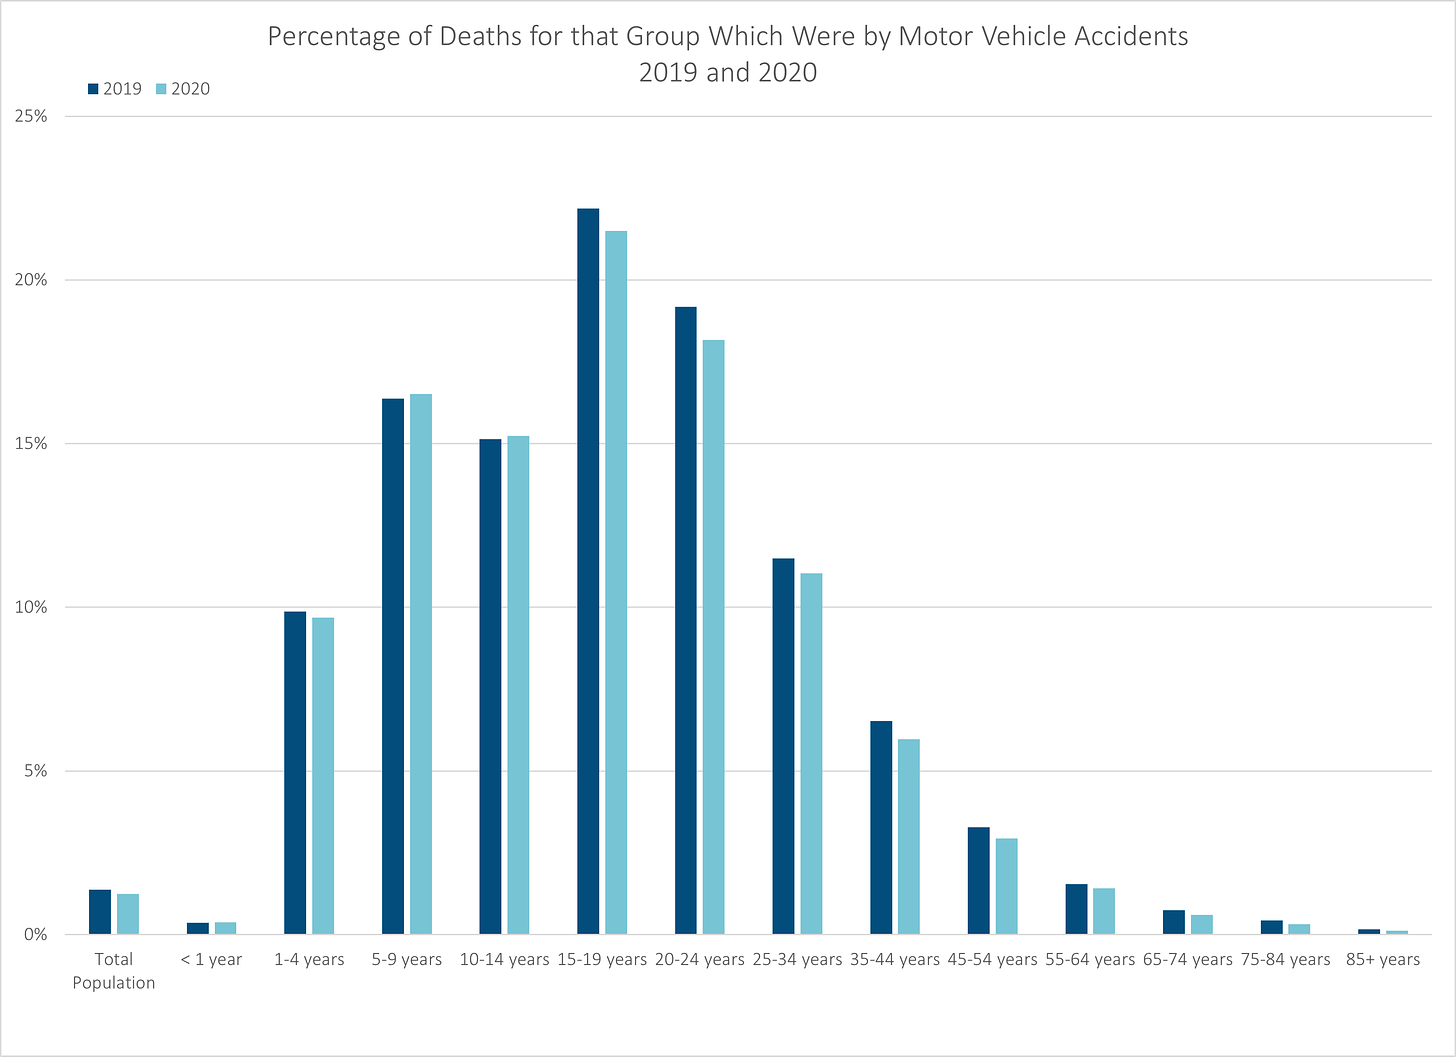
Indeed, let’s see what percentage of the deaths were motor vehicle accidents for each group.
Percentage of deaths for each age group: key cause of death for the young
As with homicide and suicide, motor vehicle accidents are a prominent cause of death for teens and young adults, and insignificant for the old:
It is interesting that even as motor vehicle accident deaths increased a lot for teens and young adults, it decreased as a percentage of the deaths for those groups.
That’s because the mortality for those groups increased, percentage-wise, much more than the percentage increases from motor vehicle accidents.
We already saw that homicides were significant increases for ages 15-44.
Just wait until I show you how much drug overdose deaths increased.
Long term trends by age groups: 1968-2020
Let’s see the long-term trends, grouping by meaningful ages: youth, working years, and retirement.
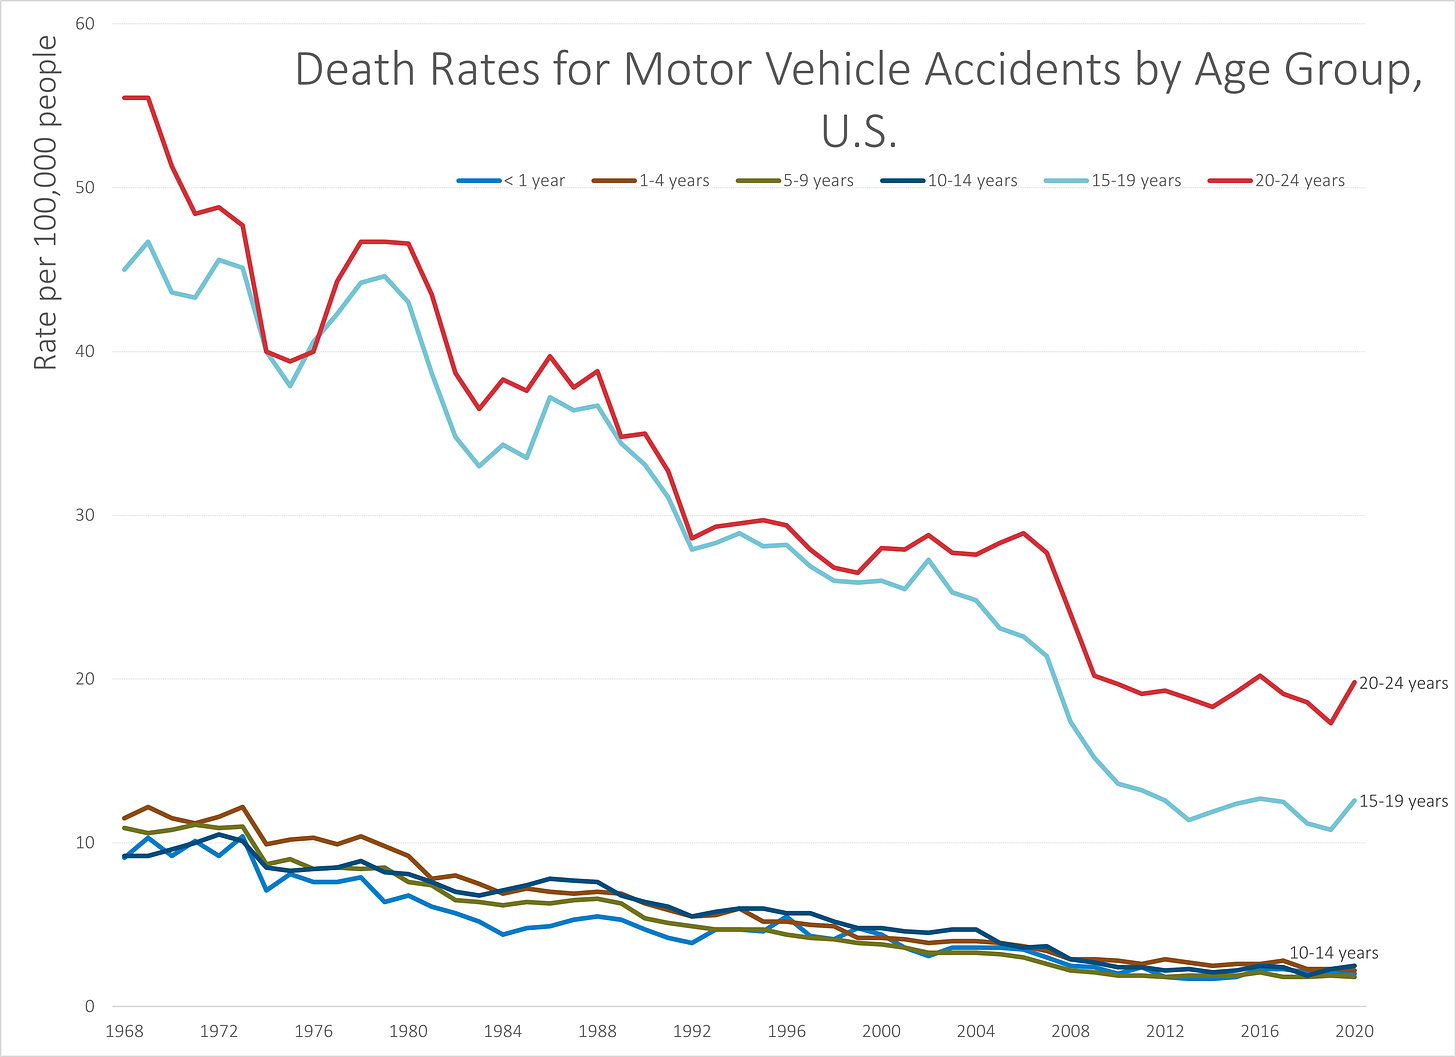
Under age 25:
I didn’t even bother to label all the lines for the kids under age 15. They’re basically all the same line, and it’s showing passenger safety, essentially. They’re not driving.
The two lines for 15-19 (new drivers, or just fewer of them driving, in recent years) and 20-24 (worst, usually, because these often no longer live with parents, more likely to be drunk driving, etc.) – those give you an idea of the fruits of reckless driving.
That said, it has been a decades-long trajectory of improvements. With more strict drunk driving laws, and various safety features in the vehicles, it looks like things have gone pretty well. Even with the increase in 2020, it’s not too bad.
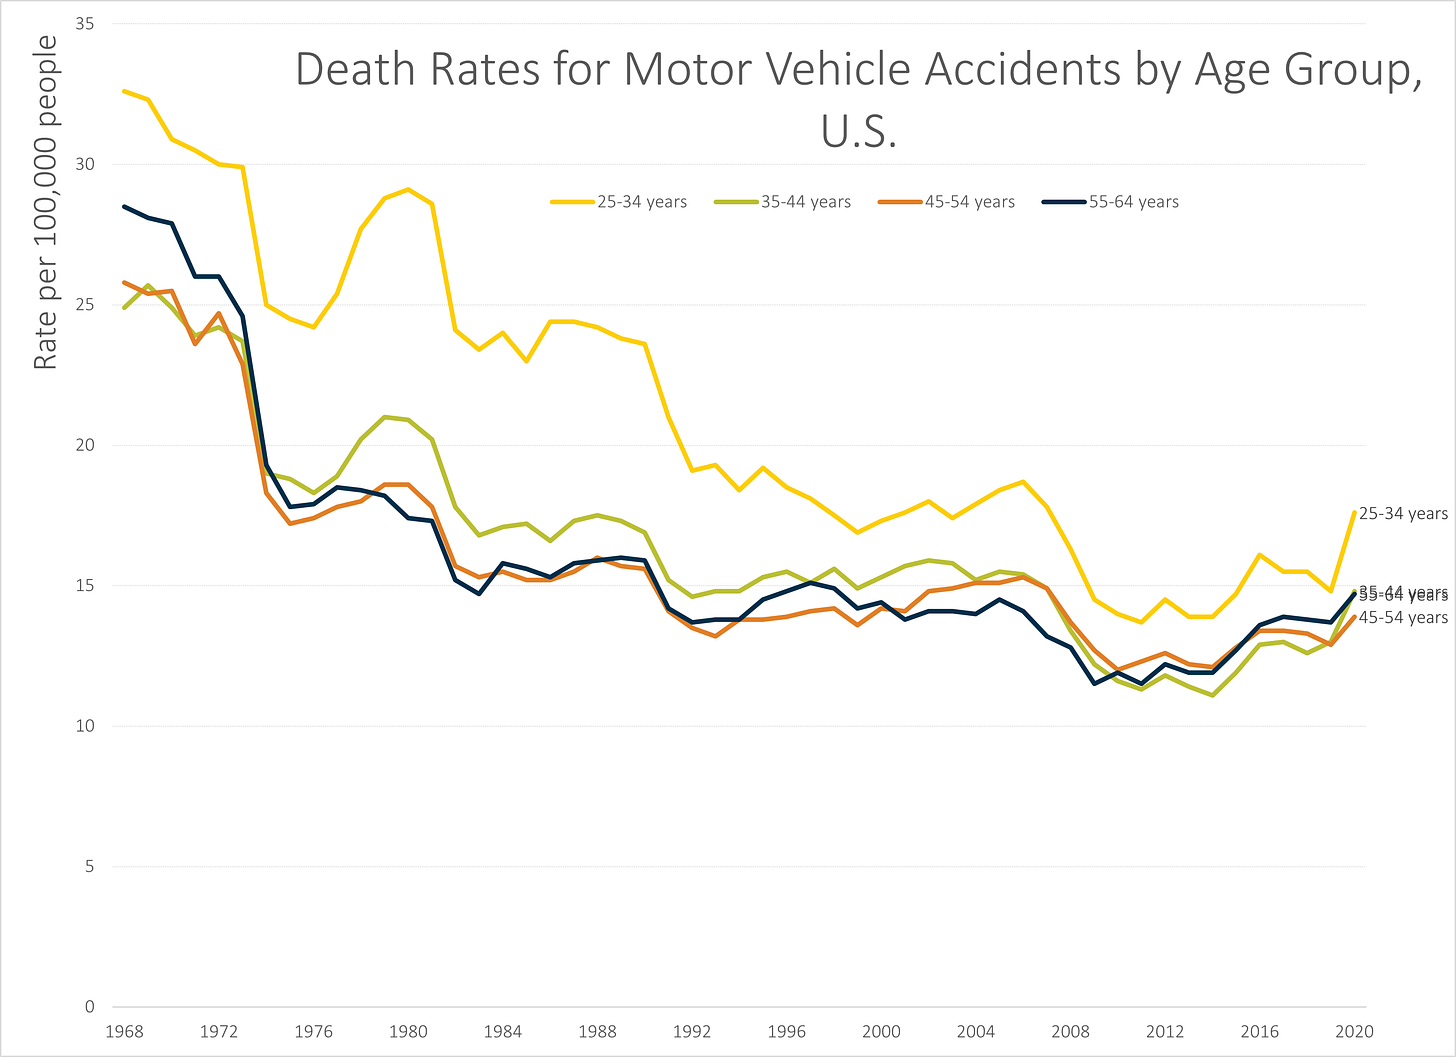
“Working-age adult” group of 25 to 64
Age 25-34 tends to be the second-worst after 20-24 in reckless driving. The recent trend does not look good there.
The age groups from 35 to 64 are essentially the same, with the curves tracing out the effects of safer cars and the ups-and-downs of more and fewer miles driven depending on gas prices, recessions, expansions, etc.
Old adult group of over age 65
We need to talk about this last group, because almost all the Boomers are in here (in 65-74, though some are younger), and it’s going to be a real problem once they’re in the 85+ bin, and we don’t have fully-autonomous cars at that point.
What’s going on? Why are so many dying? Why is the 85+ group the dying-est of the age groups for motor vehicle accidents?
Very old people on the roads are a danger to themselves
It’s certainly not because they drive the most miles, and definitely not because they’re the fastest drivers…. which should give you a little clue. And also a clue as to why they may not have died from car crashes as much during the lockdown.
To be sure, the old folks may have been stuck at home, dying of COVID, rather than puttering around and getting in accidents.
But I think it mainly goes like this – many older adults who drive have no business driving. Once you’re in the 85+ group, it’s not merely a question of reaction time; it’s a question of being able to control your limbs appropriately, never mind the incidence of dementia.
In addition, if an older adult is in a car crash, they are much frailer than a younger person. I have known many people my age or younger who have been hospitalized after crashes, needed some heavy-duty surgery and had long recoveries. If it had been an 87-year-old granny in the same situation, she probably would not have survived, even at a lower speed.
I had two posts about the increased traffic deaths last year:
May 2021: Mortality Nuggets: Car Crashes, COVID Deaths, and the WONDER of the CDC
June 2021: Mortality Nuggets: NYT Misleads, COVID Deaths Down, and Car Crash Fatalities Up
One thing I noticed in the reports is that when they measured the distribution of speeds on the roads pre-lockdown and post-lockdown, it wasn’t mainly that top speeds increased, but that the slowest speeds (20th percentile, say) increased. The slow drivers weren’t around — you know, the oldest people stayed home.
And that explains why the older adults’ traffic deaths dropped, and the speed demons could really let loose. Top speeds were what they always were — it’s just that the overall flow of traffic could be faster without the pace cars of the highways slowing everybody else down.
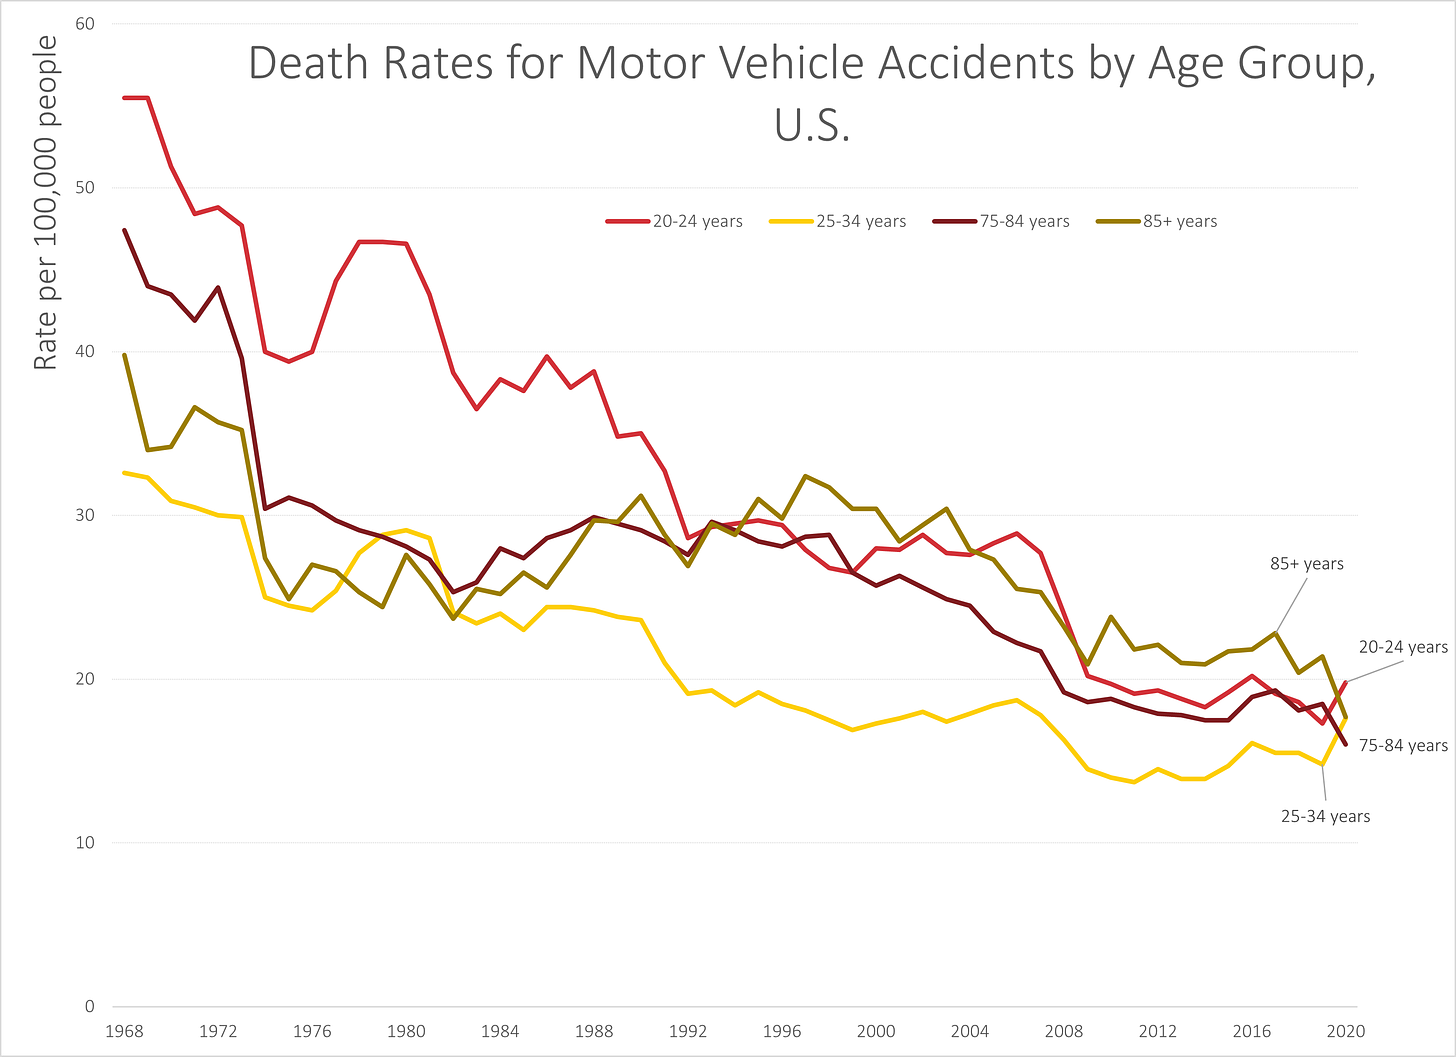
Worst death rates on one graph
Here you go:
Auto insurance folks may be a little surprised, because they generally measure these things on rates by miles driven, and the older drivers drive much fewer miles, and they certainly drove a lot fewer miles in 2020.
On the other hand, you’ve got the young adults, age 20-34, who are in the mix. They drive more miles, and the number of miles driven also dropped in 2020, but probably by a lot less than the 75+ crowd. After all, where did all the Grubhub and Instacart drivers come from?
Seasonality of motor vehicle accidents – with provisional 2021 numbers
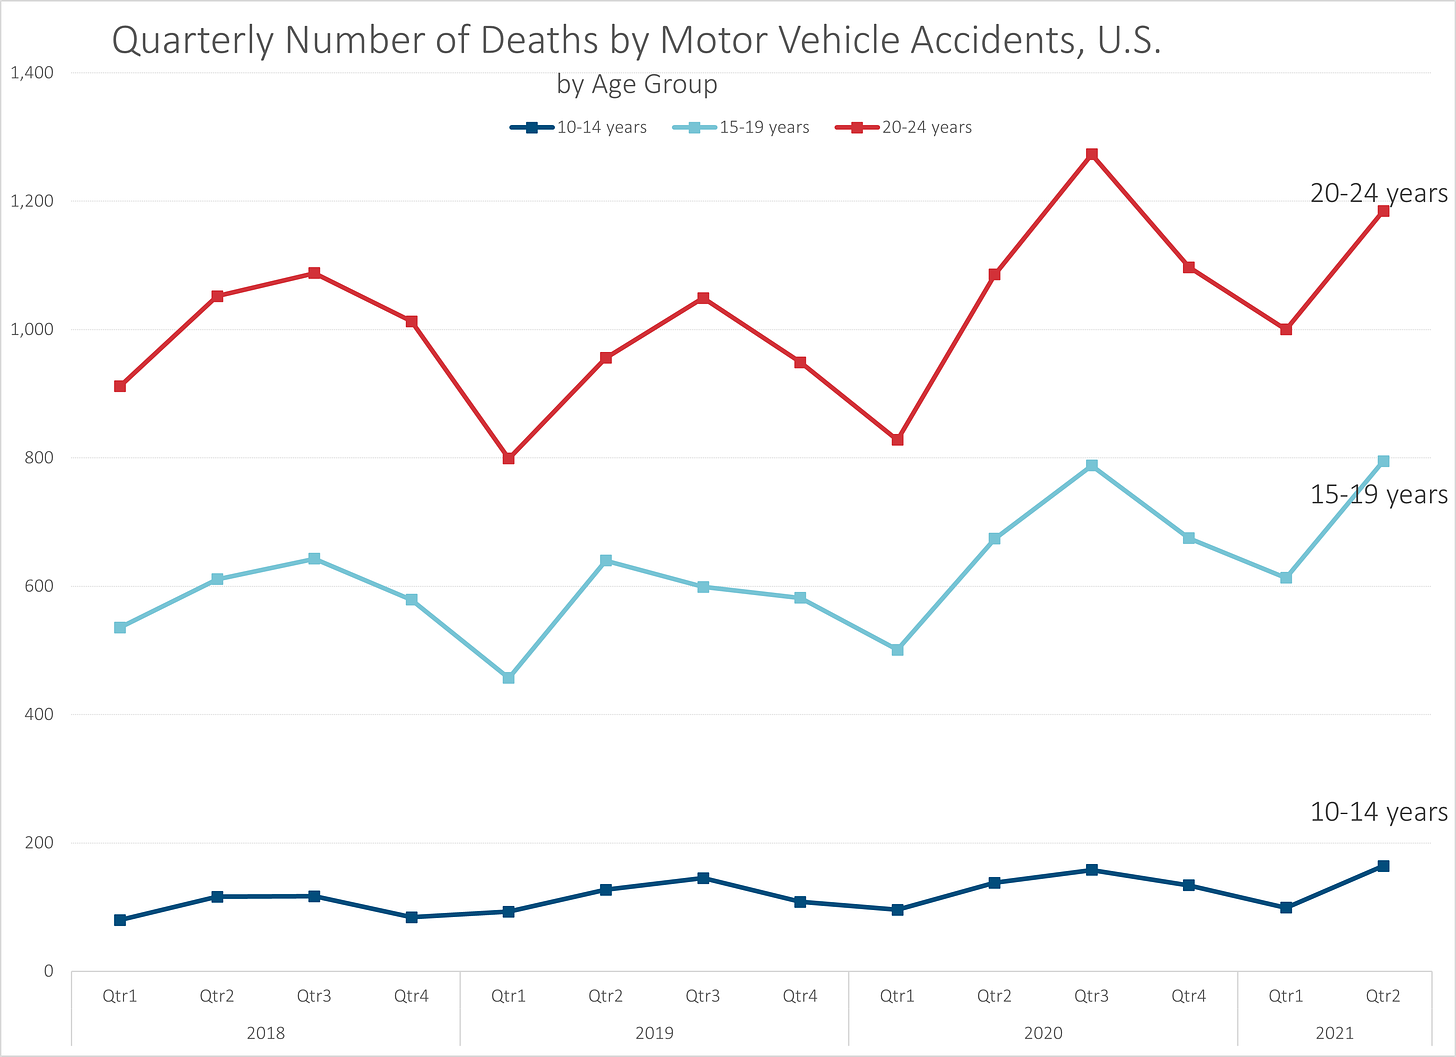
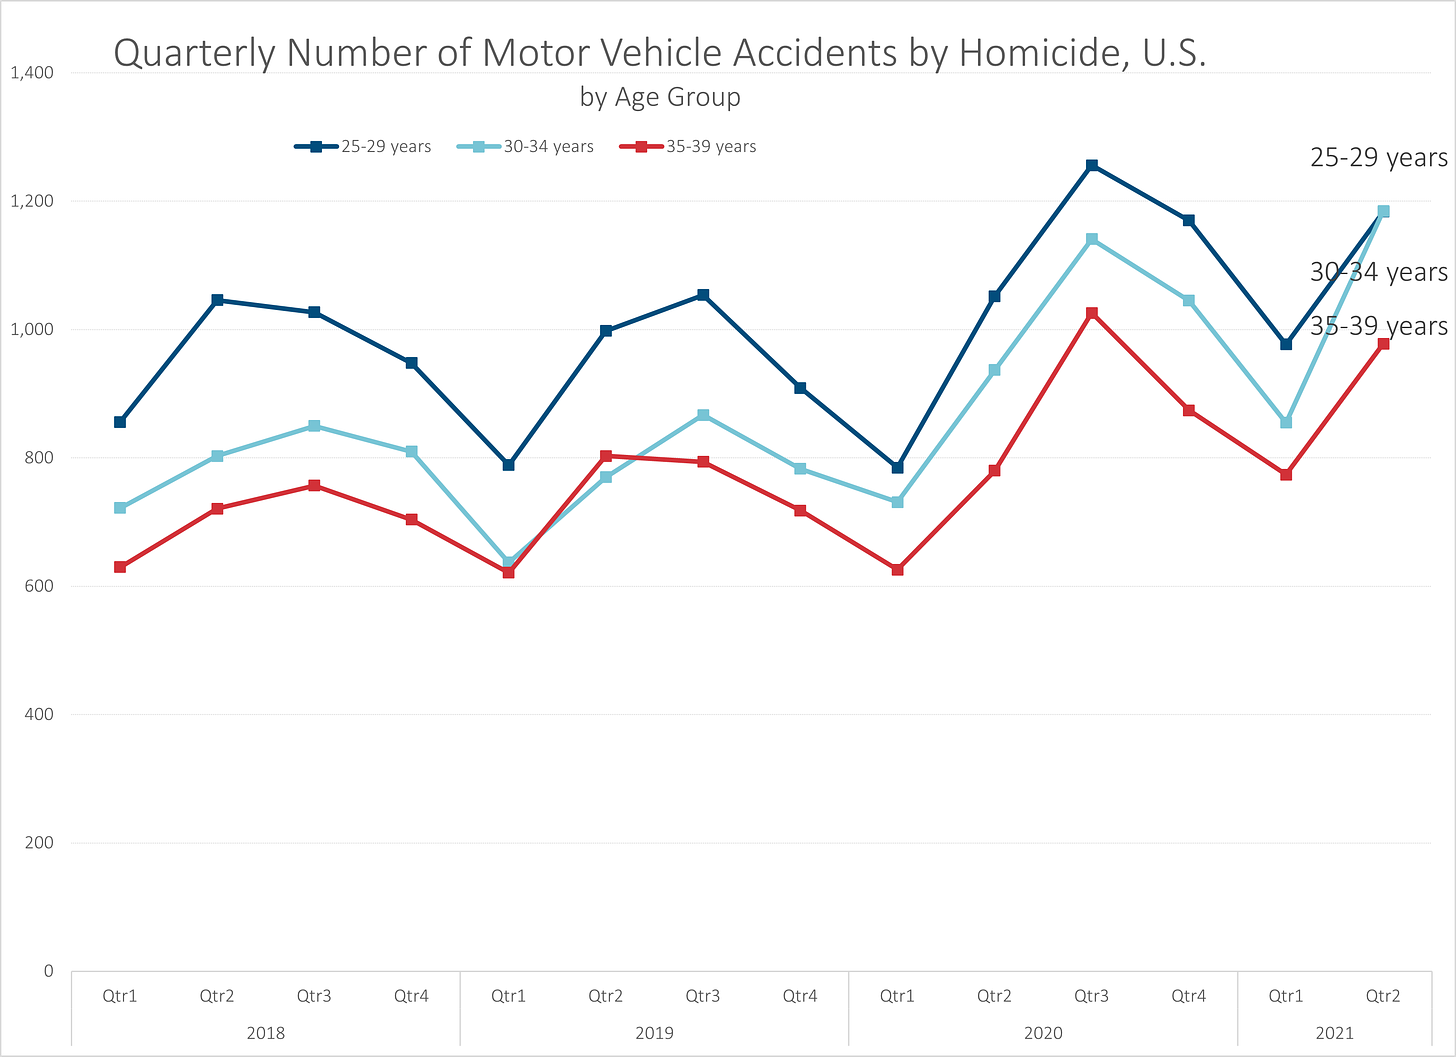
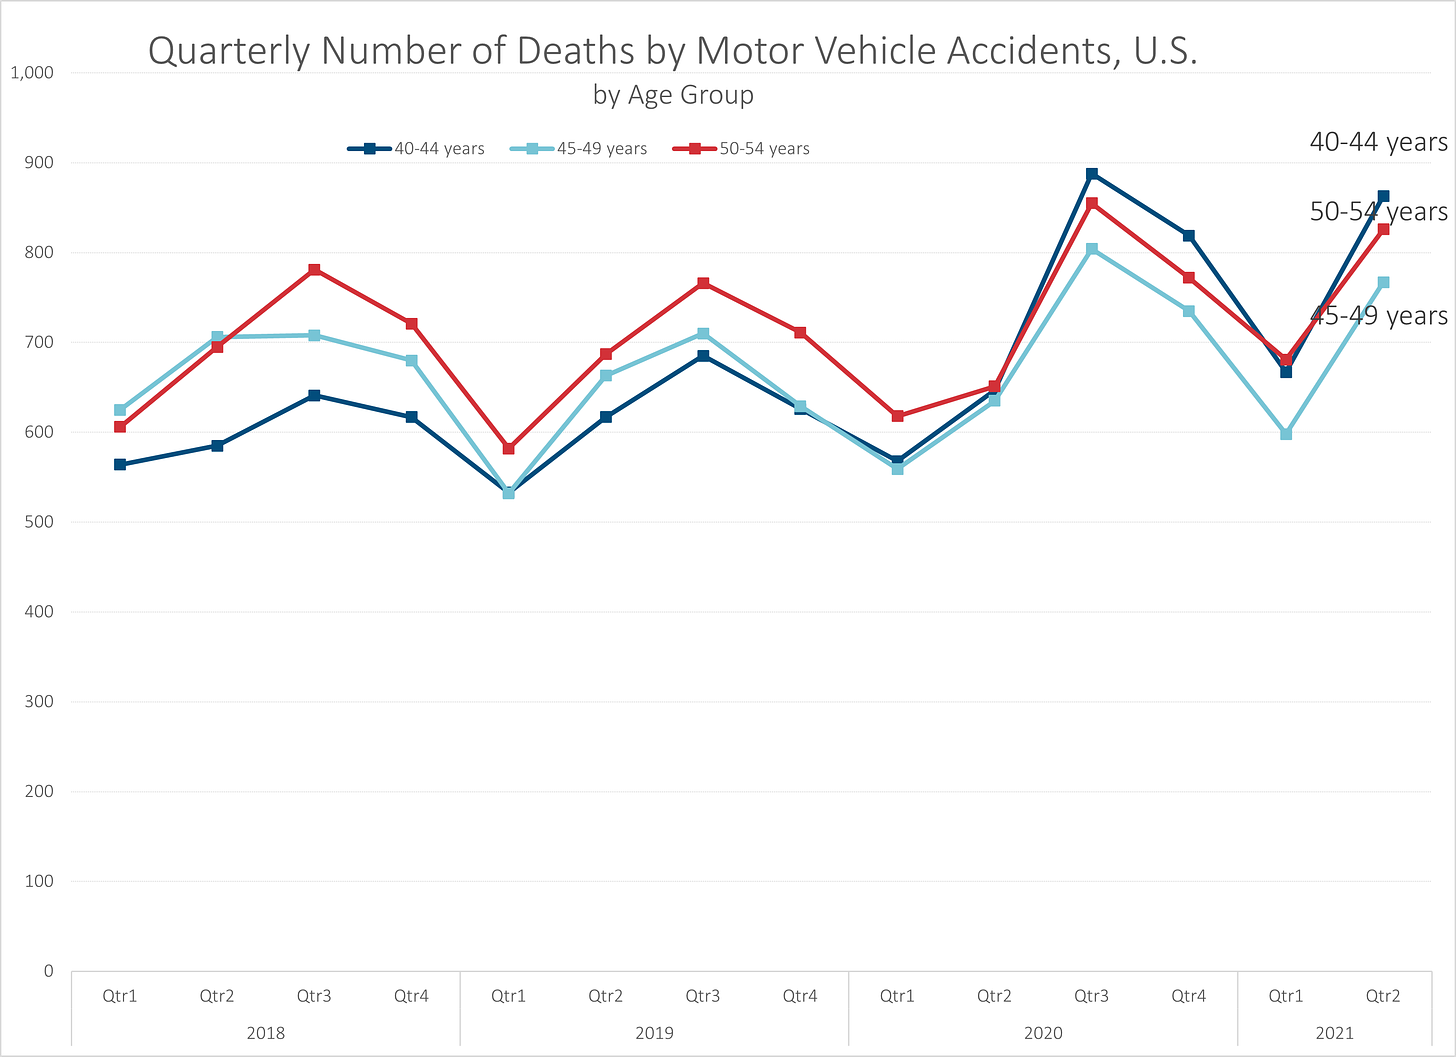
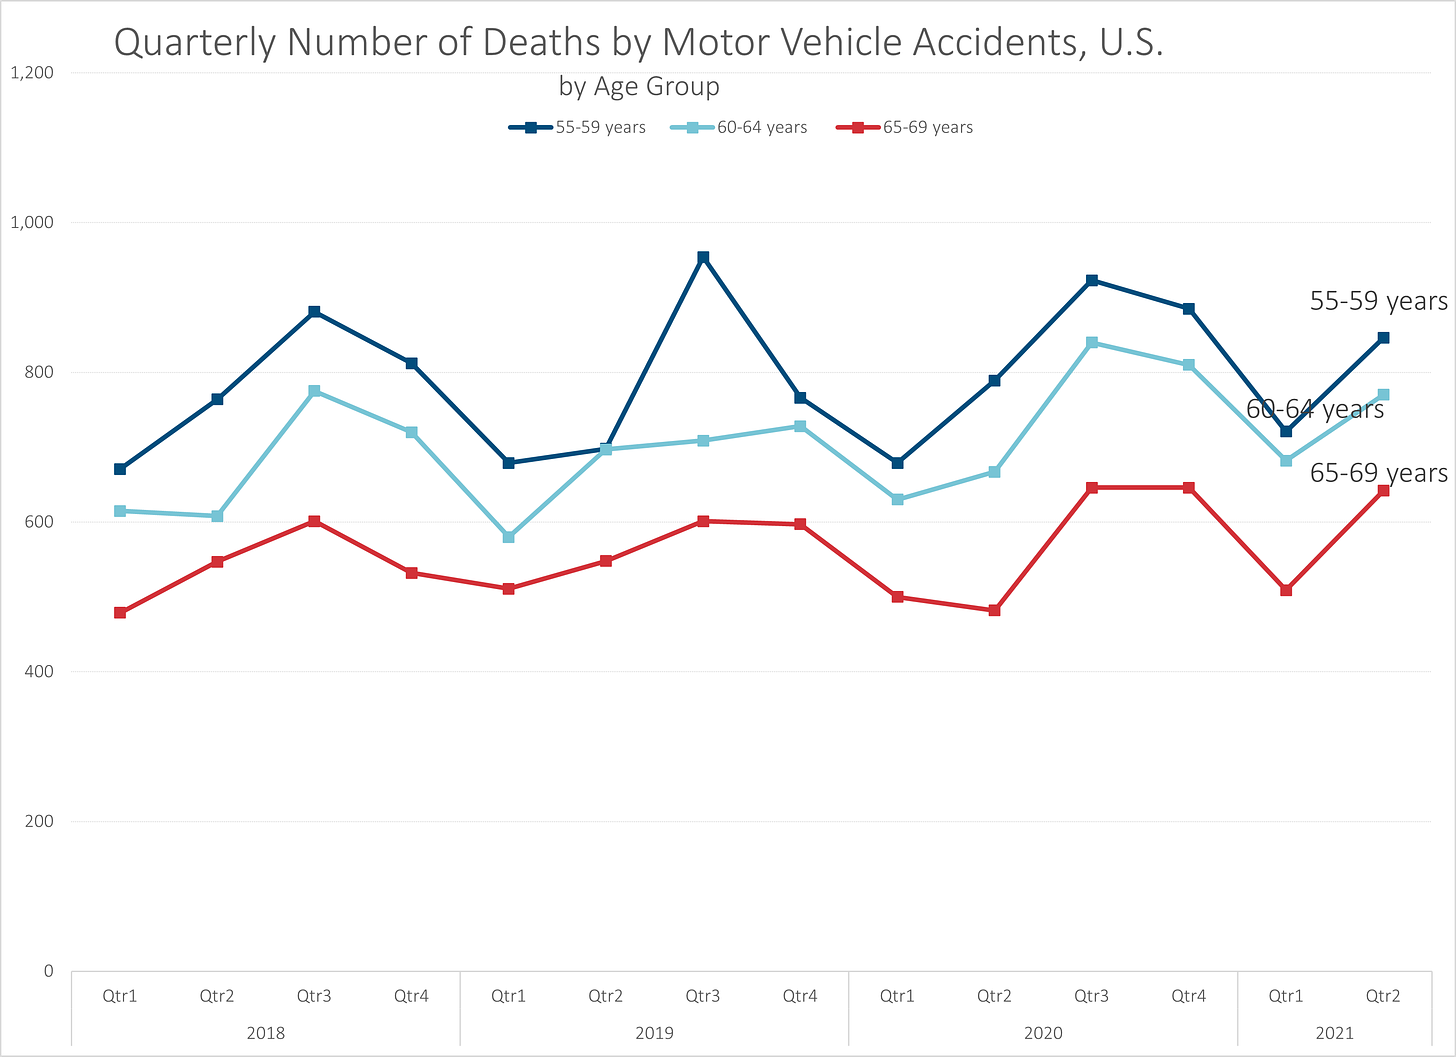
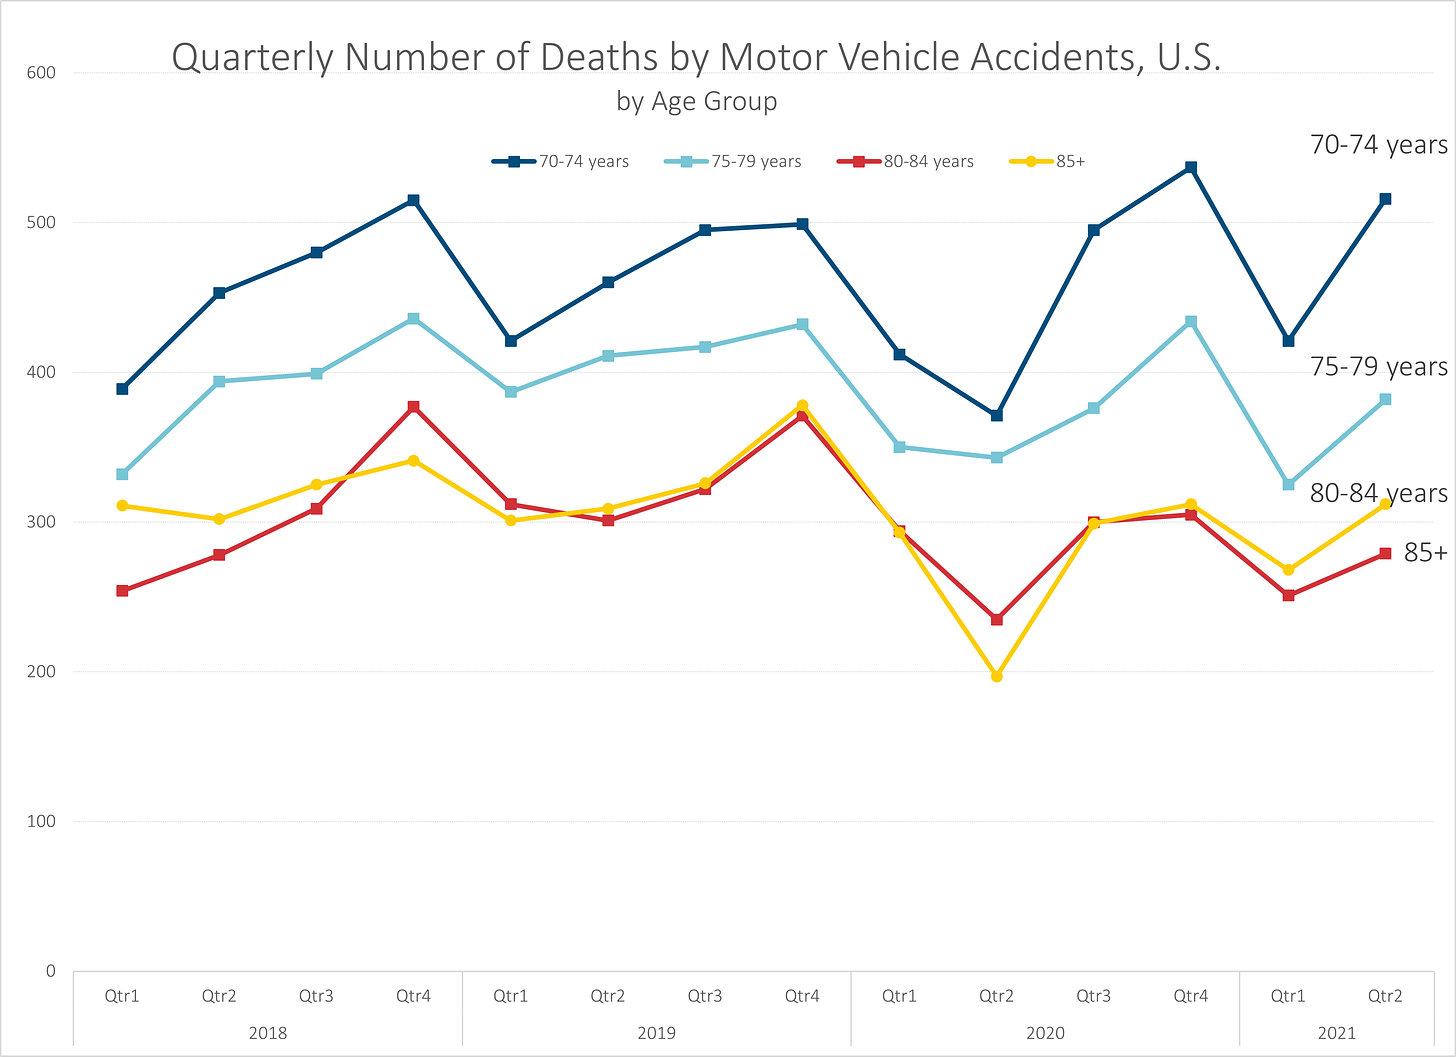
Finally, here are some quarterly graphs of motor vehicle accident deaths. These are counts, not rates. I am just going to put all of the graphs out, and these are by 5-year age groups in general. I think you will see some obvious seasonal patterns.
Most straightforward pattern: most motor vehicle accident deaths in 3rd quarter — that is, summer — vacation time! When people booze up, party, drive long distances, etc.
A few age groups do not have that pattern, but notice that most of them do. Also, notice that 2020Q3 was pretty high for deaths in most groups. I bet 2021Q3 was pretty high, too.
So the anomalous ones — the kids have so few deaths, it’s tough to talk about any pattern.
Old people have bad experience with car crashes
The older adults seem to peak in their deaths in the fourth quarter, that is, fall.
Maybe they’re getting confused with the end of daylight saving time or something. Shorter days may be messing with them.
Sundowning is a thing, and seriously, sundowning people should not be driving in the twilight.
Ugh, we’re not going to have autonomous cars in time for the Boomer motor vehicle slaughter.
And while some states may have some requirements imposed on testing the old that they’re still competent to drive…. oh, it will be politically unpopular. Those Boomers will be very unhappy when their Millennial kids try to take the keys away.
I have one more part of this series: looking at the geographical differences in motor vehicle accident death rates.
Spreadsheets:
Enjoy!

