


Mortality Nuggets: Videos on Suicide Rate Trends, Society of Actuaries Report, and Fixing Their Graph
The little known Beatles song... "I'm fixing a graph....where the trends get lost...."

Suicide Rate Trends 1968-2020
First, a video version of my last post:
For convenience, the post I was explaining:

SOA Report on Mortality Trends
A video coverage the latest Society of Actuaries report on U.S. population mortality trends:
The page for this report is here: U.S. Population Mortality Observations – Updated with 2020 Experience
The PDF of the report: U.S. Population Mortality Observations – Updated with 2020 Experience — PDF report
It looks like I can’t embed the Tableau dashboard on substack (currently) so here is the link to the Tableau dashboard: US Population Mortality by Sex
Fixing a graph: top causes of death by age group
Remember this table?
This is the graph version the Society of Actuaries did in their report:
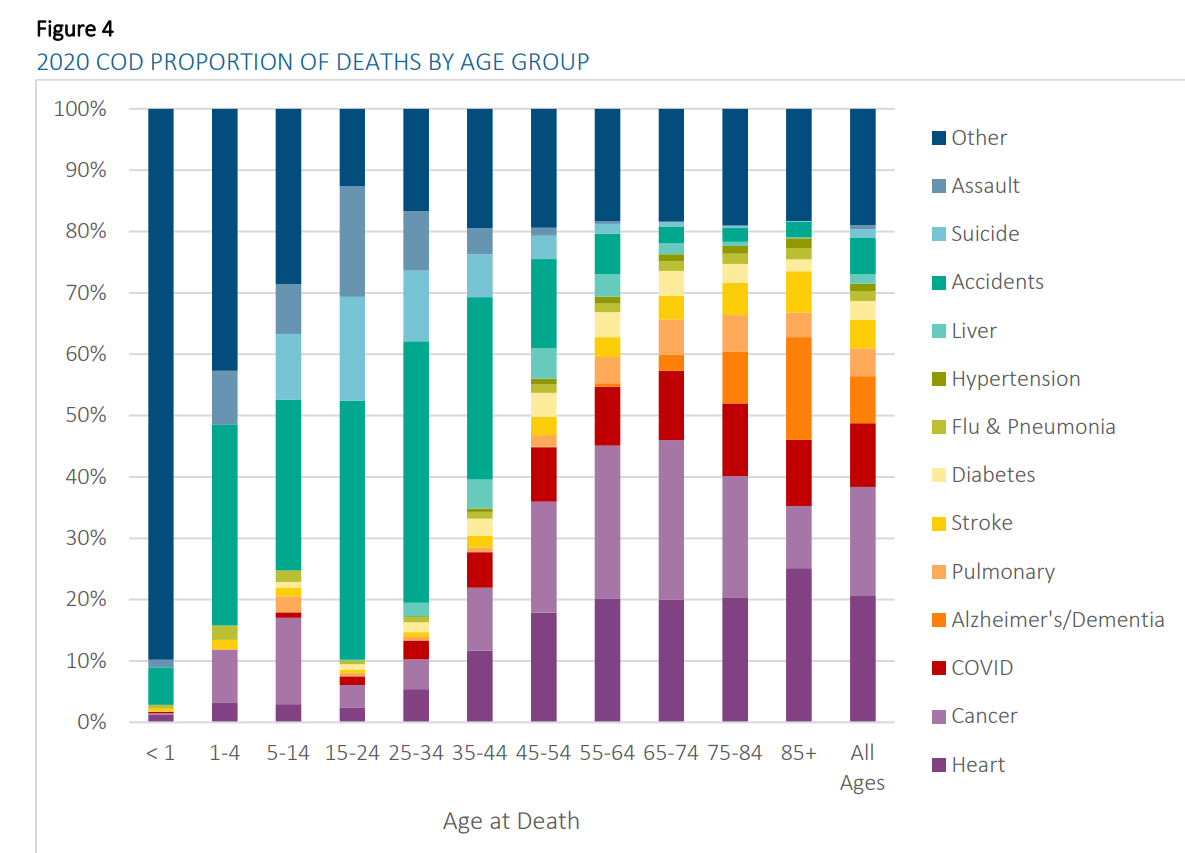
I made comments in the video that this graph wasn’t friendly to the color-blind, but worry not — if you’re not color-blind (like me), you may still have had problems with the graph.
I am going to redo this graph.
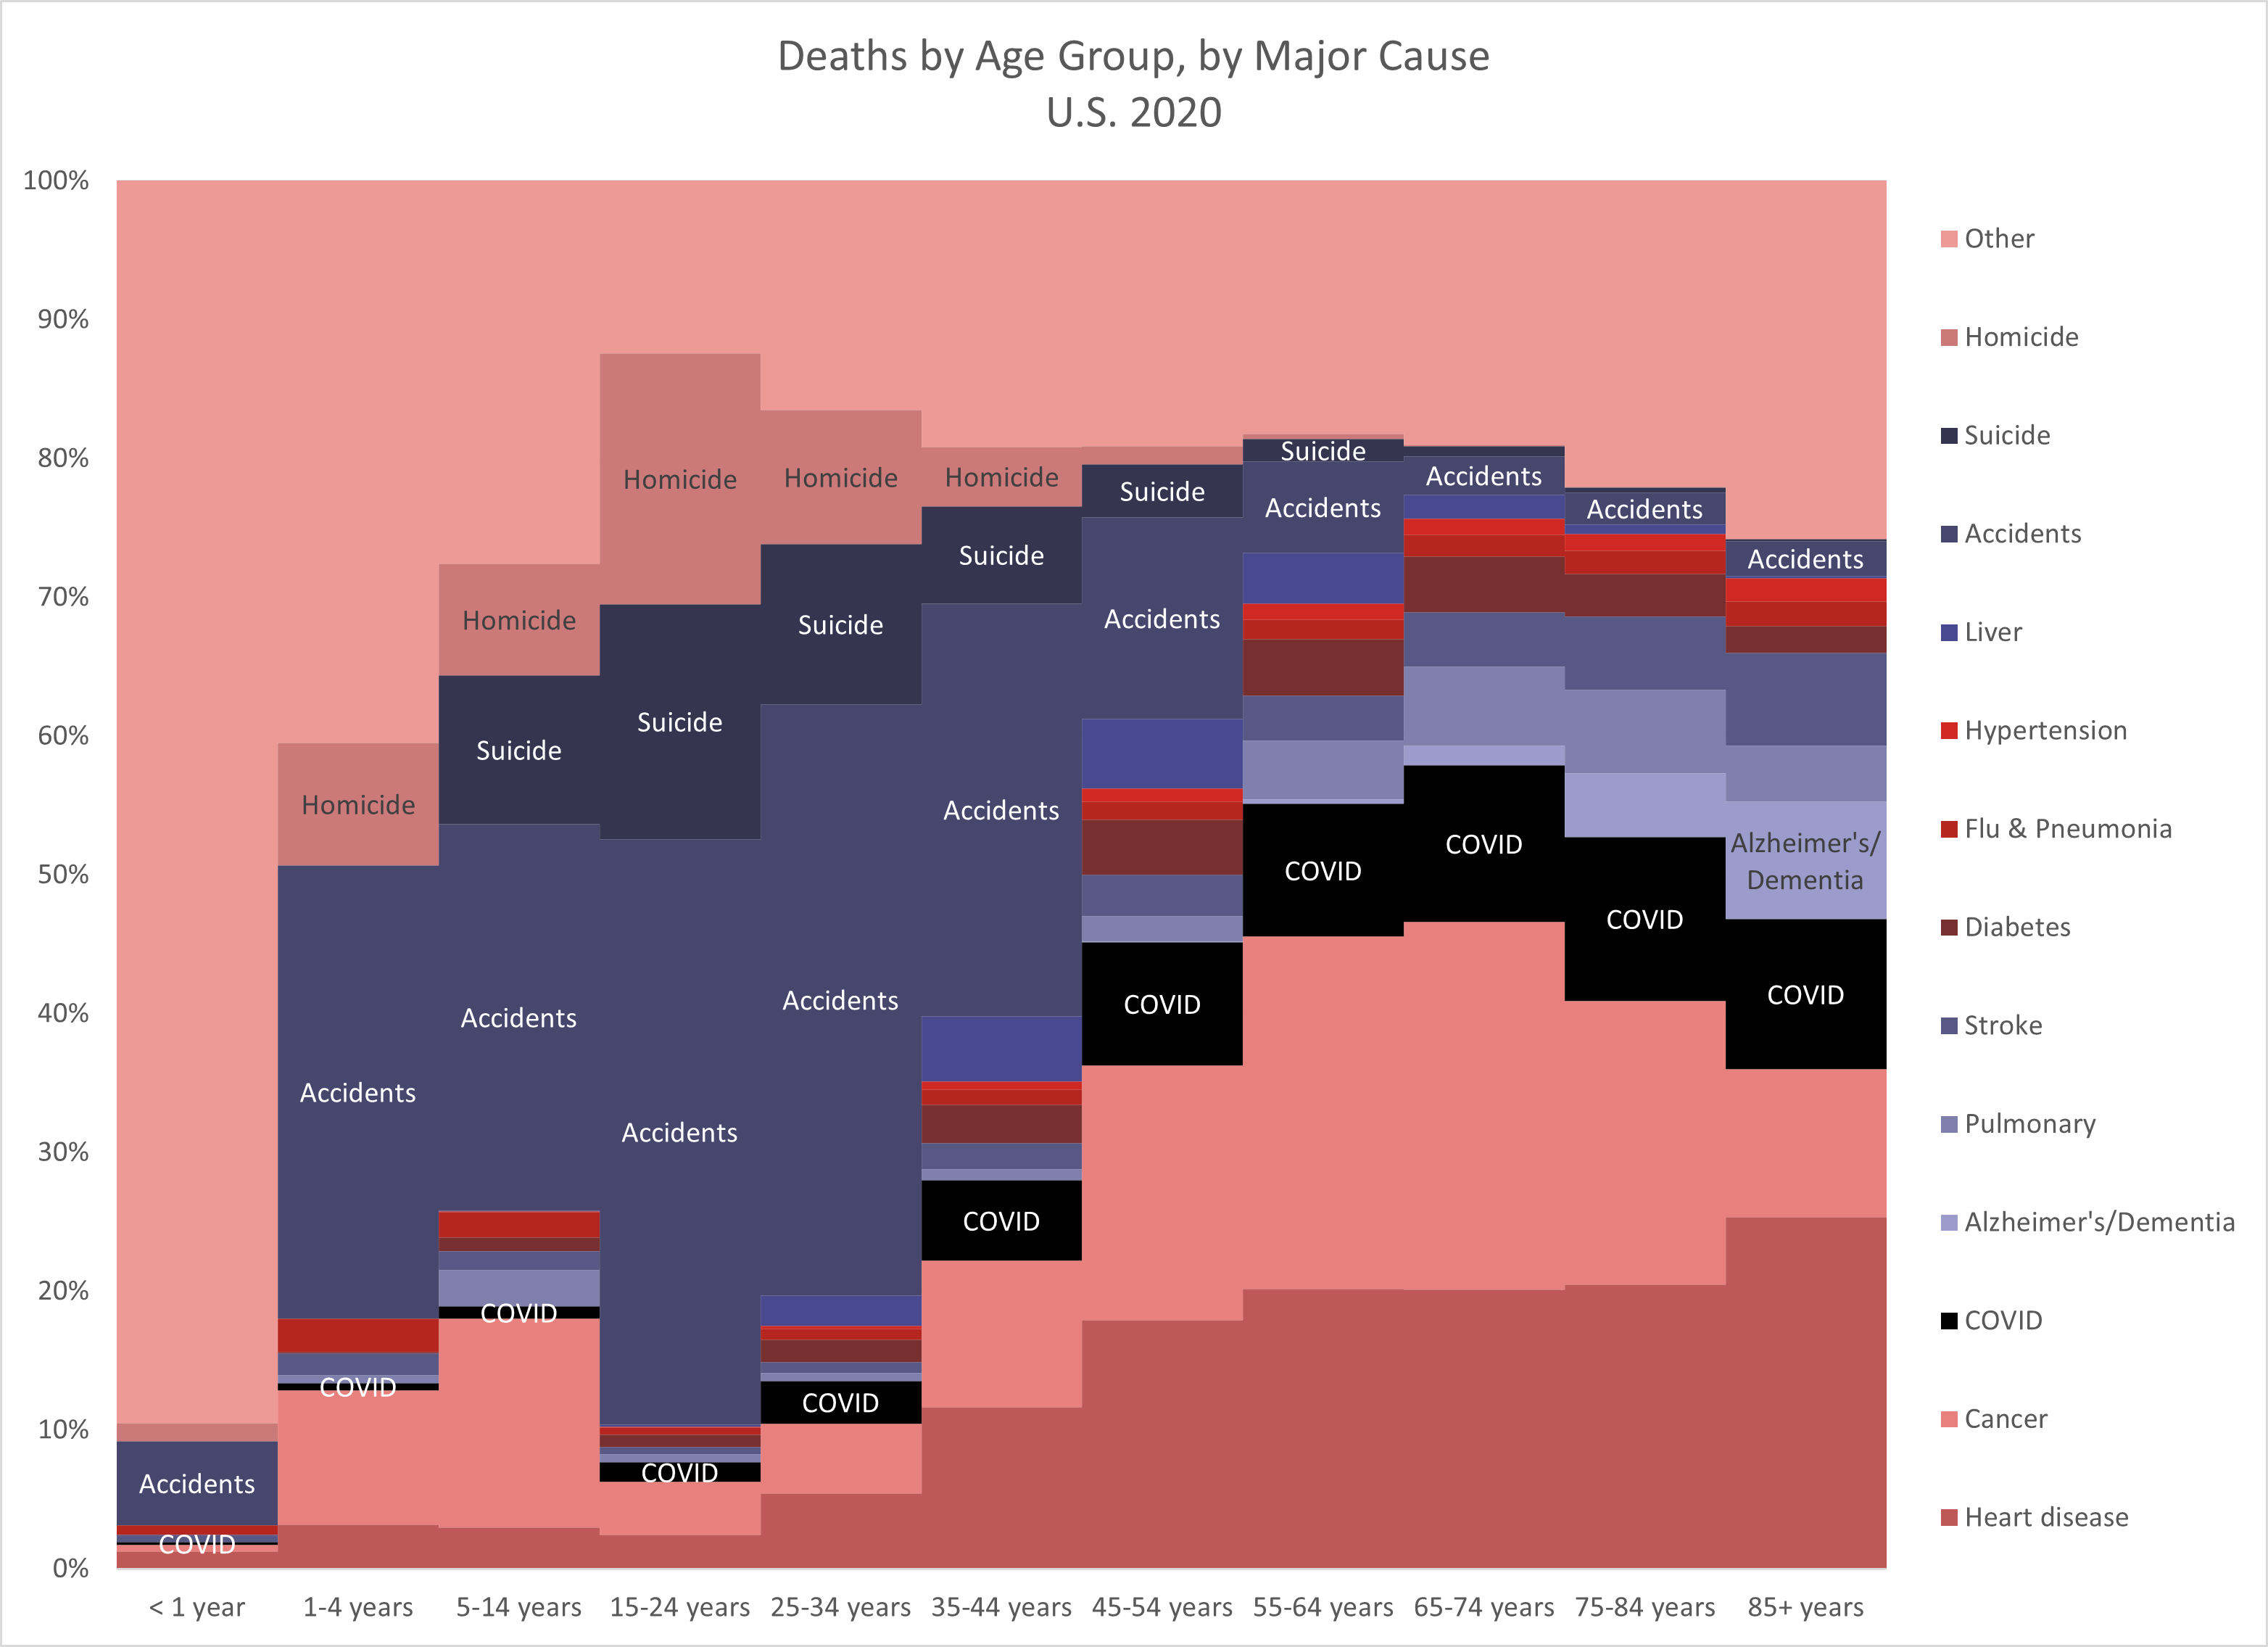
Yeah, I know my color choices are a little odd (see this post for explanation for where I grabbed my colors.)
A few comments:
I highlighted a few of the cause-of-death trends. In particular, COVID (which, obviously, is biased more towards the old), and external causes of death: homicide, suicide, and accidents (which includes drug overdoses and motor vehicle accidents).
There are basically too many things going on in this graph, so there aren’t a lot of good choices for either me or the SOA. What I did was to pick four of the data series to highlight with data labels, as noted above (and I also slapped one data label on dementia for the oldest age group, just because). I am in the middle of a series going through how that external causes of death changed in 2020 — in particular, accidents and homicides went up, and really affected mortality for adults under age 45, plus male teens.
Yeah, check out heart disease and cancer (bottom of the graph). Ain’t old age great?
As you can see, “accidents” are a huge cause of death for younger adults.
Usually, homicide isn’t number two as a cause of death for young adults — suicide usually edges it out. But that wasn’t true for the age 15-24 group in 2020.
My next major mortality post will be on the nasty bump up in homicide in both 2020 and 2021. And that has a much larger age effect than does suicide.
Memento mori.
UPDATE: [sorry forgot to put the spreadsheet here]