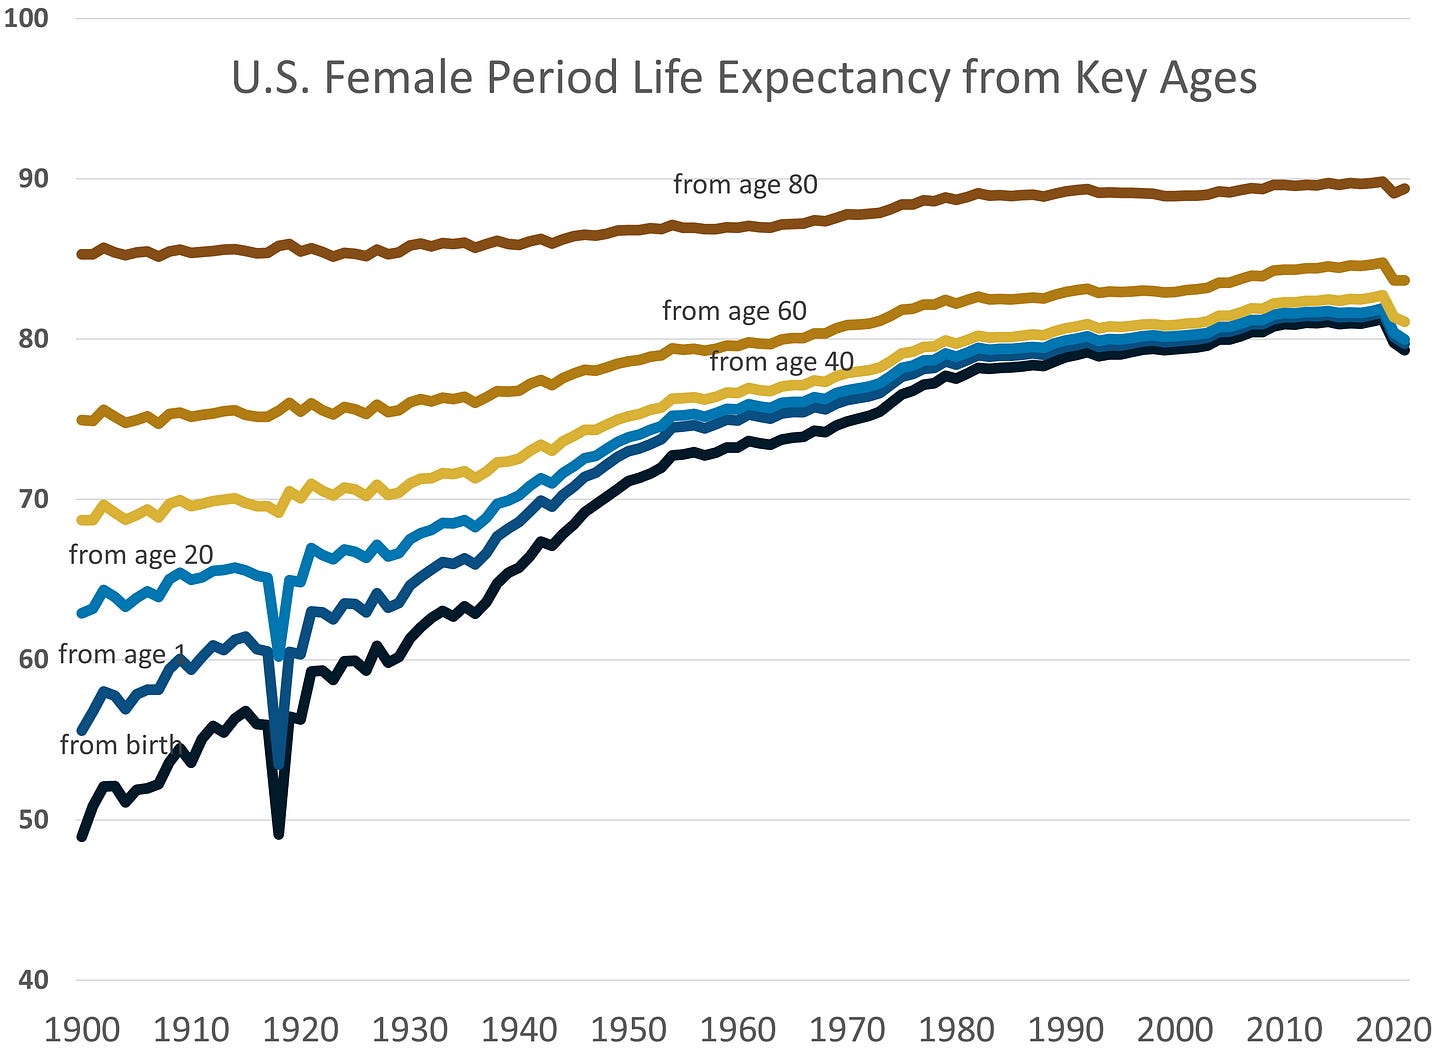
Longer Term Mortality Trend in the U.S.: Period Life Expectancy by Sex, 1900-2021
Seeing the impact of two pandemics, and the slower effects of public health improvements
After the recent post on very long-term mortality trends in England and Wales:
Very Long-Term Mortality Trends in England and Wales, 1841-2022
Yesterday, Stuart MacDonald MBE posted the following at LinkedIn:
You can look at that post to see the explanation for period life expectancy.
In this case, the source of information is the most recent set of period life tables from the Social Security Administration Trustees report, which has historical experience by sex from 1900-2021.
U.S. Male Period Life Expectancy, 1900-2021
U.S. Female Period Life Expectancy, 1900-2021
Changing Speeds
Let’s look at a similar summary table of changes in period life expectancy at specific ages and years. For males:
And females:
If you contrast the U.S. curves to the England & Wales ones, you can’t see any wars on these curves. However, you can see both the 1918 Spanish flu pandemic and the COVID pandemic on a large scale.
Spanish flu interlude
In the case of the Spanish flu pandemic, it was a one-year hit to period life expectancy… that’s not been the case with COVID and all the repercussions.
You can also see that the Spanish flu pandemic only affected period life expectancy from the younger ages — it’s best understood by looking at the “from age 40” curves, which didn’t bobble. There had been flu pandemics in decades before which some posited conferred immunity to those who had lived through them, so didn’t have as much mortality from the Spanish flu pandemic when it came through. However, younger people (or people in more isolated communities which missed prior pandemics) had higher mortality from that.
A paper discussing some of these theories: Protective immunity and susceptibility to infectious diseases: lessons from the 1918 influenza pandemic, Nat Immunol. 2007 Oct 19;8(11):1188–1193. doi:10.1038/ni1530
Flattening the improvements
Then there is the case of the rapid life expectancy increases in the first half of the 20th century, which then slowed down.
There was a flattening mid-century, which is about the same time as the peak of heart disease death rates:
After that peak around 1960, life expectancy improvement started to accelerate again for a little bit… but then slowed down again. Notice that cancer death rates were rising.
The two large trends were tied with smoking. Now we have other trends going on.
One of the more interesting trends has been the large increases in life expectancies at old ages for 1930-1990 compared to other years. I will have something to say about the potential causes for the slowdown in longevity improvement for old ages since 1990, especially for females. But not today.
These are very broad strokes for the overall population, and if I split it down into smaller demographics, you would see different patterns emerge.
Rapid improvements from reducing infectious disease
Much of the huge improvements for the early 20th century came from improvements in public health like the Pure Food & Drug Act of 1906, better sewage treatment and drainage in cities, and later diphtheria treatments, vaccines, and antibiotics.
The discovery of penicillin in 1928 by Sir Alexander Fleming (1881-1955) marked the beginning of the antibiotic revolution.2 Ernst Chain and Howard Florey purified the first penicillin, penicillin G, in 1942 but became widely available outside the Allied military in 1945.3 This marked the beginning of the antibiotic era. This antibiotic era witnessed the discovery of many new antibiotics, and the period between the 1950s and 1970s was named the golden era of discovery of novel antibiotics, and no new classes of antibiotics have been discovered since then. After that, the approach to discovery of new drugs was the modification of existing antibiotics.4
The antibiotic era revolutionized the treatment of infectious diseases worldwide, although with much success in developed countries. In the US for example, the leading causes of death changed from communicable diseases to non-communicable diseases (cardiovascular disease, cancer, and stroke), the average life expectancy at birth rose to 78.8 years, and older population changed from 4% to 13% of the entire US population.1
Again, look above at the life expectancy graphs.
People have been used to very low mortality, relatively, for a long time. So an increase to mortality that drops the period life expectancy about a year or two, pushing back the life expectancy to where it had been within the decade, was shocking to many….
….but go way back to the early 20th century, and consider the huge impact of the Spanish flu pandemic on the period life expectancy. That mainly came from the death of young adults. Not old people.
Very different perspective there.


