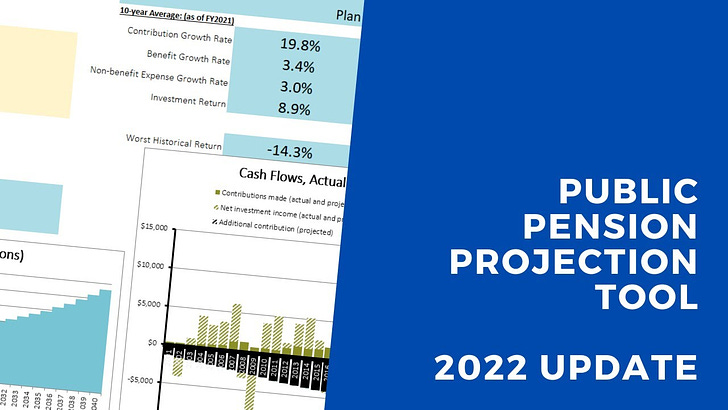
I know, I know, and you didn’t get me anything.
Well, you’re giving me your attention, which should be gift enough.
Video explainer
Here’s a video with a few demos:
A screenshot
There’s basically no difference from prior versions except:
- There is an additional year of data, so most plans have data to fiscal year 2021 now
- I changed my file versioning to date-based labeling.
A downside
Because most of the plans are ending fiscal year 2021, this will give a misimpression of “good health” for the plans, as the investment returns that year were very high.
As we know, the returns for FY2022 have been bad for most plans, given how they’re invested. Just due to reporting lags, we don’t have them in the database yet.
I decided not to have my “asset shock” in the spreadsheet anymore, but it’s something to consider as you play with it.
Something to try that I didn’t note: a higher-than-historical benefit growth rate due to higher inflation.
Spreadsheet to download
Enjoy!


