First, before I jump into this — some of the Mortality with Meep readers may be interested in this piece:
Nature, 24 June 2025: How to make America healthy: the real problems — and best fixes
Disclosure: I’m linking… because I’m quoted.
Deaths from substance misuse are explained mainly by overdoses of synthetic opioids such as fentanyl — part of the US opioid crisis. Many Americans are killed in traffic accidents, partly because they tend to spend proportionately more time driving, and in bigger cars, than people in many other nations. “We’re a very car-centric society,” says Mary Pat Campbell, a life-insurance specialist who works at the investment management firm Conning in Hartford, Connecticut, and blogs about mortality data. “We don’t have a lot of good mass-transit alternatives.”
I also provided some other background.
If you’re new to STUMP (named after my late husband Stu & me, MP), I write about not only mortality trends, but also public finance, public pensions, and fraud and other issues. I also have a substack about sumo: Sumo Stats. My posts are all free to read (but if you want to comment here… it’ll cost ya!)
But I am writing about mortality today because it’s been a scorcher!
Heat Deaths — Underlying or Contributing Cause of Death
For UCD (underlying cause of death), I can use only X30 (Exposure to excessive natural heat) when I query WONDER (the CDC database which aggregates death certificate information.)
The UCD is the one and only one cause listed on the death certificate as the primary reason for death.
However, up to 20 causes may be listed on a death certificate, to explain the chain of events leading to death. While heart failure, for instance, may be the UCD, one of many heat-related causes may be a contributing cause of death. I may wish to query the following from the MCD (multiple causes of death) WONDER database:
P81.0 (Environmental hyperthermia of newborn)
T67.0 (Heatstroke and sunstroke)
T67.1 (Heat syncope)
T67.2 (Heat cramp)
T67.3 (Heat exhaustion, anhydrotic)
T67.4 (Heat exhaustion due to salt depletion)
T67.5 (Heat exhaustion, unspecified)
T67.6 (Heat fatigue, transient)
T67.7 (Heat oedema)
T67.8 (Other effects of heat and light)
T67.9 (Effect of heat and light, unspecified)
X30 (Exposure to excessive natural heat (hyperthermia))
I can get only X30 data from the UCD database — the others all show up in the MCD database. T codes in general are used in contributing causes of death.
This goes to say, if I want to look at heat-related deaths, I need to look at two separate databases.
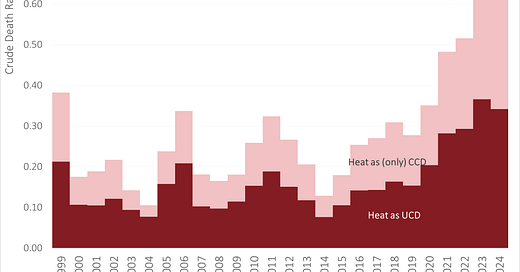
For a long time, heat being the UCD (that is, X30) of the heat-related deaths was around 60% — except in 2023 and 2024. It was about 50% in those years. In 2023 and 2024, there were a lot more death certificates recording heat as contributing causes of death.
Hmmm.
Geography of Heat Deaths (X30), 1999-2024
For this post, to keep it simple, I will solely look at heat as the UCD, so the X30 deaths.
I need to get a sufficient number of deaths to get results from the CDC database, so I drew from 1999-2024.
Yes, Wyoming is missing. So is North Dakota. There weren’t enough deaths recorded.
For comparison, here is the same map for cold deaths (X31).
Yes, over the period, there were a lot more deaths due to cold.
That may not hold into the future. But it may not simply be a result of climate change. It may also be due to shifting population and shifting age distributions.
A lot of those heat deaths are in Arizona. (Guys, it’s in the state’s name. It’s ARID there.) But also — who dies from heat?
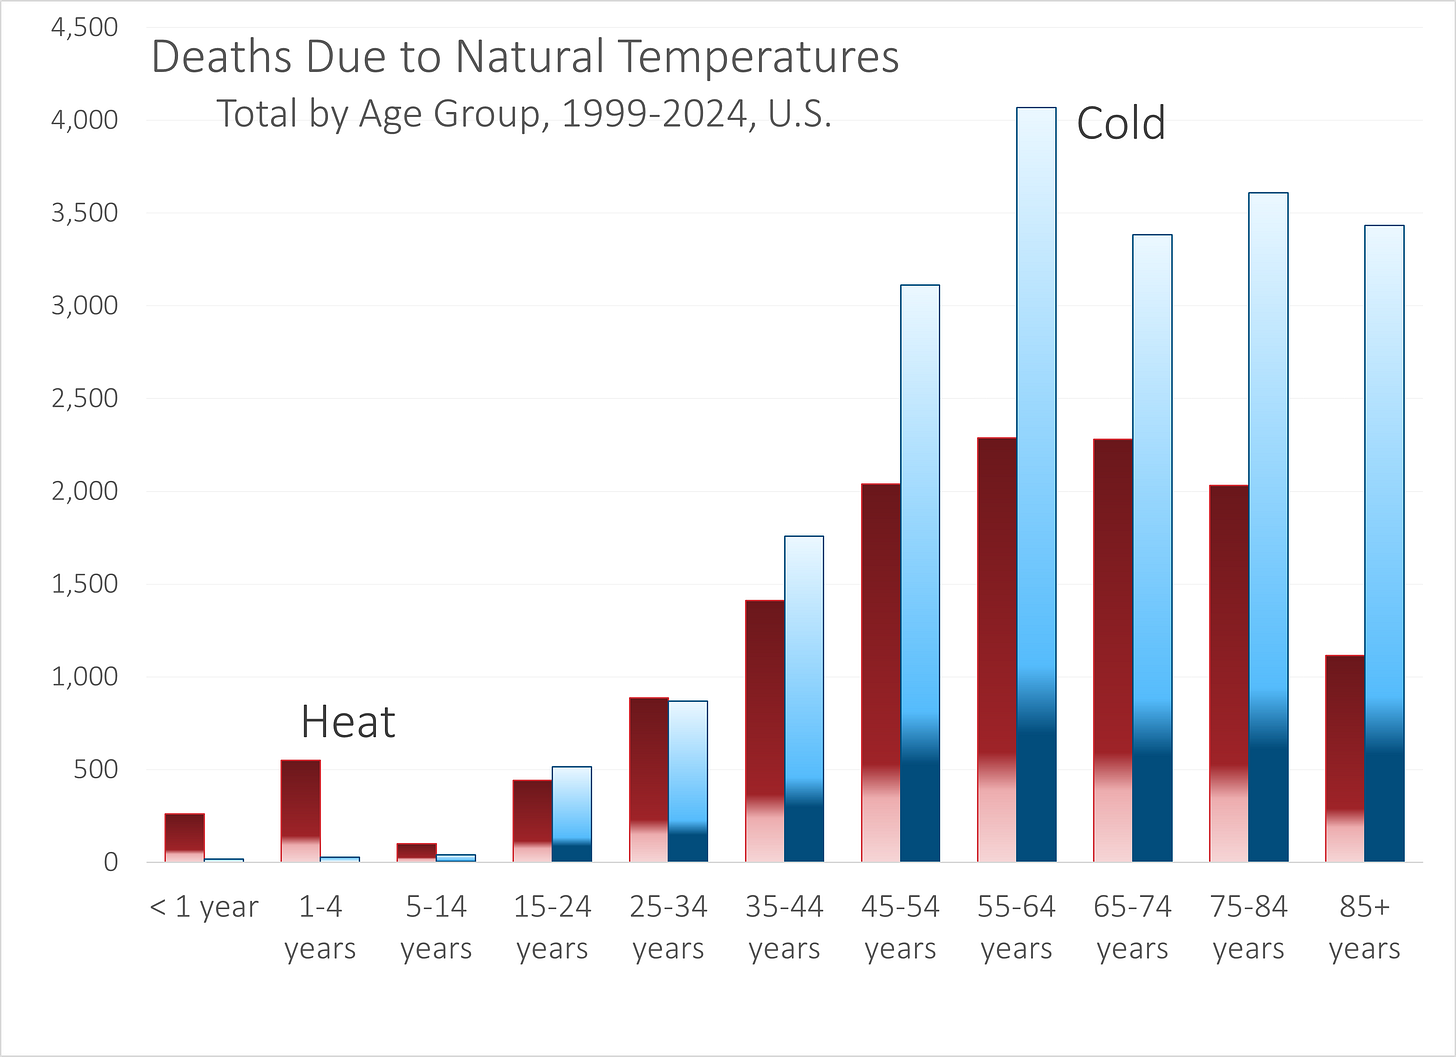
Age distribution of heat deaths, 1999-2024
Again, I’m putting in deaths due to cold in for comparison.
For heat, there is the sad statistic of babies and toddlers dying, and I think we all know how. So we will stop thinking about that one and see that the peak ages for death by heat in adulthood is middle age. That’s by count.
Death by cold, though, tends to be more common among seniors — if you think about how many people are age 85+ compared to those age 55-64, the death rate due to cold is far worse for seniors than for heat.
So what we see is extreme vulnerability to cold for seniors. But that’s over the entire 1999-2024 period.
What if we focus solely on 2021-2024?
I didn’t have enough deaths due to cold among children (under age 15), but one can see that heat deaths dominate for those under age 55.
Heat death rates for the children are at about where they were before (and again, if you think about how that happens, you realize that’s not climate-related).
But for adult ages, the rates have increased across the board, and for younger adults are exceeding deaths due to cold. Again, some of it may be due to people moving away from northern states to the hotter climes. Not many heat-related deaths in North Dakota, after all.
I will have to take a look at that later.


