Classic STUMP: Visualizing the Financial State of the States
Many were in a bad place even before COVID-19
This one is just from last September, but even if you’ve been a long-time reader, it may be good to look at.
I decided to re-run this one because I used a visualization, the tile grid map, in yesterday’s post on visualizing excess deaths in 2020. I keep adjusting the template to make it work better each time.
Below, a lightly-edited version of the older post:
The Financial State of the States in September 2019
Yesterday [25 Sept 2019], Truth in Accounting released their tenth annual State of the States report. The full PDF of the report can be found here.
Using the data in the report, I’ve made some visualizations – first everybody, and then, some key states.
Surplus and Deficit
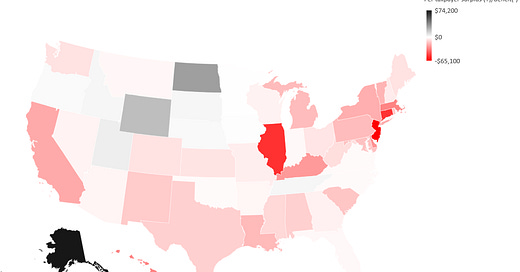
Using the per-taxpayer surplus/deficit as our first measure, let’s check out a nice choropleth:

Remember, in all of the following: black is good, red is bad. (The in-the-red meaning you owe money, in-the-black meaning you don’t owe).
So, I don’t like choropleths for non-geographic stuff. You can barely see the small states, and it’s difficult to visualize these. You get a distorted idea of the meaning, so it’s better to use something where you can see all the states as equal area.
So let’s do a tile grid map!

So, there are issues with this one as well (look, I got the arrangement from this site, and I’m too lazy to move the states around. You should be able to generally find what you’re looking for.
The interesting thing is that it’s easy to see clusters here. I selected the “breakpoints” to line up with either an important marker (the $0 making the difference of being in-the-red from in-the-black), or quintiles.
The worst quintile is what I’d call the Yankee cluster: NY, NJ, VT, MA, CT, DE — that’s 60% of that quintile right there. It’s rounded out with IL, KY, CA, and HI. Interesting.
The ones that manage to break even or better…. notice that most of them are out west. Also interesting.
Worst States
I could focus on the best states (Alaska, with its Alaska Permanent Fund), but it’s always most fun to look at the worst, isn’t it?
TIA made a video:
But this data really isn’t rich enough to do an animation. Let’s do a line graph that uses the worst 10 from 2019, and go back as far as TIA’s data do.
If I did ten lines for all the years, that would get a bit messy… and who really cares about the year-to-year changes? It’s the long-term behavior that counts.
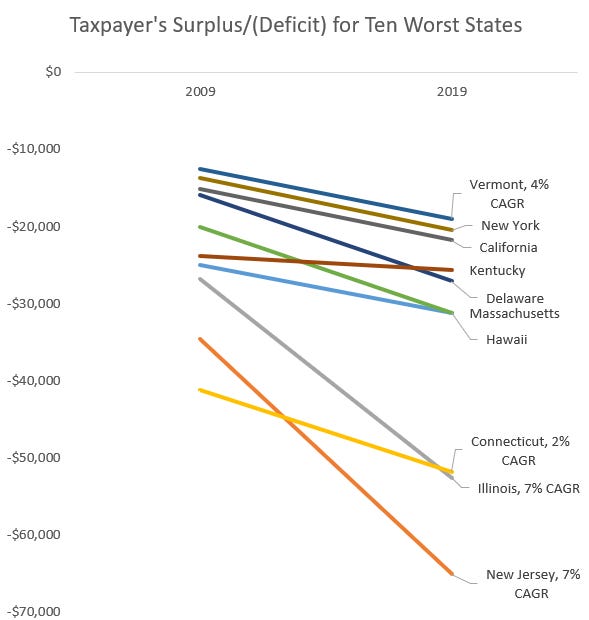
So let’s do a slope graph from 2009 to 2019 for the worst 10 from 2019:

Some comments: many of these states have a debt per taxpayer growing at about a 4% per year rate. A few had slower rates, such as Kentucky and Connecticut.
Some had much higher rates: Illinois and New Jersey at CAGRs of 7% per year for the ten year period.
So note that while the CT debt per taxpayer did grow, due to its slow growth it went from the worst state in 2009 to the third-worst state in 2019. Huzzah. I suppose.
But now I may want to rethink the “Illinois is gonna go bankrupt before New Jersey” prediction I made long ago. That said, this is just the state-level debt. This is not incorporating, say, Chicago’s debt load.
Yeah, I’m still going with Illinois going bankrupt first.
Most Improved States
Let’s take a look at the states with positive slopes — that is, those that improved their positions on a per-taxpayer basis.

We should probably ignore Alaska, North Dakota, Idaho, and Wyoming — my guess is their surplus relates to oil in some way. That said, Alaska and Idaho had been deficit position in 2009, so way to go!
But North Carolina, Georgia, New Hampshire, Maine, and West Virginia — good for them in improvement! Yay!
One may as well take good news as one can.
Bailout for States?
Here’s the deal: most states are in a situation of at least a little bit of debt, which is not necessarily bad. If there’s a growing population, if the debt is for capital projects like bridges and the like: all is fine.
But if that debt is for unpaid bills of the past, like pension debt, this is not a good thing.
So let’s look at the maps above. None of these are weighted for population — but let’s think about it. There’s the: will Georgia be willing to bail out Illinois?
But more than that: will Georgia be able to bail out Illinois?
RESOLUTION
Expressing the sense of the Senate that the Federal Government should not bail out any State.
Whereas every State in the United States is a sovereign entity with a constitution and the authority to issue sovereign debt;
Whereas the legislature of every State in the United States has the authority to reduce spending or raise taxes to pay the obligations owed by the State;
Whereas officials in every State in the United States have the legal obligation to fully disclose the financial condition of the State to investors who purchase the debt of the State;
Whereas Congress has rejected prior requests from creditors of a State for payment of the defaulted debt of a State; and
Whereas, during the financial crisis in 1842, the Senate requested that the Secretary of the Treasury report to the Senate with respect to any negotiations with any creditor of a State relating to assuming or guaranteeing any debt of the State, to ensure that promises of support by the Federal Government were not proffered: Now, therefore, be it
That it is the sense of the Senate that—
(1)the Federal Government should take no action to redeem, assume, or guarantee any debt, including pension obligations, of a State; and
(2)the Secretary of the Treasury should report to Congress any negotiations to engage in actions that would result in an outlay of Federal funds on behalf of creditors of a State.
This was introduced by Sen. Tom Cotton (R, Arkansas) this summer. It hasn’t gone anywhere.
Note: Arkansas is at a $2,300 debt per taxpayer.
An Old Argument [which is coming back]
I will give a contrasting view, from 2018 — Bloomberg: If Rich States Need Federal Help, Remember They Paid for It
Yes, Connecticut is in trouble. No, it’s not going to follow the path of the Greek debt crisis.
….
Mitch Daniels, president of Purdue University and former governor of Indiana, compared the state budget crisis with the European debt crisis, with Connecticut and Illinois playing the role of Greece and Italy. But this analogy gets the relationship backward. Daniels also argued that the structure of the U.S. Senate will prevent “profligate” states like Connecticut from being bailed out by others, but given the structure of U.S. taxation, it’s entirely appropriate for some of the overburdened states to get federal help.….
But Connecticut and Illinois are not poor states. Connecticut is third in GDP per capita, and Illinois is 11th, the highest in the Midwest. Last fall, the Office of the New York State Comptroller released a report looking at federal taxation by state, and it showed Connecticut paid more per capita to the federal government than any other state, and Illinois was 10th. Both states paid more to the federal government than they got back in federal spending. Daniels’s Indiana, by comparison, paid less than the national average and received more in federal spending than it paid in taxes.This is the outcome we should expect in a progressive tax system, where richer states pay more in taxes than they get paid, with poorer states getting the opposite outcome. But it reframes the fiscal problems now plaguing these wealthier states. Yes, the pension systems of many of those “profligate” states were irresponsibly pumped up by legislators and unions. But it’s a little perverse for politicians in Indiana to be scolding Connecticut for financial troubles, when Connecticut has long subsidized the finances of Indiana.
The progressive tax system of the U.S. has generally served the country well. For decades, coastal and Northern states have been wealthier and more economically developed than Southern and interior states, and transfer payments from the former to the latter have helped grow and sustain the economies of underdeveloped states.
Indiana: $1,700 debt per taxpayer
Connecticut: $51,800 debt per taxpayer
Illinois: $52,600 debt per taxpayer
I found this piece on per capita federal funding [given the description… it looks like direct benefits to individuals, like SNAP and perhaps Medicare or Social Security, are included. That’s not exactly a fair comparison.]
Indiana: $2,359 per resident
Connecticut: -$4,000 per resident
Illinois: -$364 per resident
So let’s see… if we just let the CT folks shovel the “excess” taxes right back into state coffers, then that debt could be paid off (assuming a 0% interest rate) in 13 years. Of course, CT would likely goose public employee pay and benefits if that were the case, pushing off that payoff date.
As long as CT has a few of those super-rich they manage to hang onto, they should be okay.
But what about Illinois? And Indiana?
Nobody Is Able to Bail Out Illinois
Illinois barely gives more than it takes in, on a per capita basis. It has a population of 12.7 million. Indiana has a population of 6.7 million.
[squint]
I don’t think Indiana will be able to bail out Illinois. Indeed, it looks to me like the deadbeat states, except for a few like Connecticut, will not be able to be bailed out. Their debt is too huge.
And the politics… well, somebody want to lose the Senate over California, Illinois, and New Jersey? Even some “blue” states could flip solidly red in such a situation.
Back to May 2020
Yes, I did a bit of bait-and-switch, didn’t I? Yes, I did re-run this post partly because of the tile grid map visualization….
… but mostly because it ended with the earlier version of state bailout politicking… well before COVID-19 hit.
The old arguments are being dredged up again, and the desperation of profligate states is only going to get worse as time goes on, especially as so many of them are not planning on cutting public employee pay or even positions.


Extremely insightful. You are on a higher and enviable plane. Thank you.