Classic STUMP: Public Pensions Primer--The Choice of Discount Rate and Return Volatility
Down, down, down go the discount rates
As I mentioned last week, for the next few Fridays I’m rerunning my “Public Pensions Primer” posts that I originally wrote, starting in 2015.
This post is a reworking of Public Pensions Primer: The Choice of Discount Rate and Return Volatility from July 31, 2015. In some places, I will have updated info from 2020.
Changing the discount rate to reflect experience
In July 2015, we saw that Calpers didn’t have such a great year, asset-wise, and now there are results from experience:
CalPERS officials want to lower the pension fund’s volatility by reducing the system’s 7.5% assumed rate of return over time.
To do this, they would cut the fund’s allocation to riskier investments such as stocks and increase bonds and other less volatile asset classes in a move that officials acknowledge would constrain returns in up markets but reduce losses in down markets.
The board of the nation’s largest defined benefit plan is scheduled to discuss two staff proposals at its Aug. 18 meeting — both of which would lower the assumed rate of return of the California Public Employees’ Retirement System’s $302.2 billion investment portfolio over the next 20 to 30 years. Board members could act on the proposals at their October meeting, according to CalPERS documents.
“The returns will be slightly less during the good years, but they also won’t be as bad during the bad return years,” said CalPERS’ Chief Financial Officer Cheryl Eason in an interview.
Finally.
But wait, what’s this?
While CalPERS board members expressed general support for the proposals at the May meeting, one board member, J.J. Jelincic, said he is concerned about sacrificing investment returns by taking less risk. “I am not sure de-risking is the way to go,” he said. “I think we can hit 7.5% return over the long term,” he said.
Keith Brainard, research director of the Austin, Texas-based National Association of State Retirement Administrators said half of 126 surveyed state and municipal plans lowered their assumed rates of return to an average 7.68% at the end of 2014 from 8% as of June 30, 2010.
Mr. Brainard called the CalPERS’ proposals “creative” because officials there want to reduce the rate gradually to avoid major spikes in employer contributions.
But Jeffrey MacLean, CEO of investment consulting firm Verus, Seattle, said CalPERS’ time frame for the portfolio volatility reductions is so long that significant investment losses could mute its effectiveness.
Here’s the thing.
The percentage return may reduce in volatility the longer the time horizon, but the actual dollar amount… that may vary quite a bit.
The effect of return volatility
Instead of doing present value, I’m going to project the future value of funds. We will see what the difference in a compounding annual rate makes.
Let us suppose we are putting $1000 in an account today, and we assume it will accumulate at a compound annual interest rate of 7.5%.
Let’s look at what the accumulated value is at different points in time:
1 year: $1075
10 years: $2061
20 years: $4248
Again, see the power of compound interest.
Now, actual experience would deviate from our assumptions. This research paper (Stefan Gerlach, Michela Scatigna and Srichander Ramaswamy, “150 years of financial market volatility”, BIS Quarterly Review, September 2006) has some good stats on stock market volatility, and the long-term stock market volatility seems to be about 13% annualized, and bonds being about 2% annualized volatility.
Let’s just go with a 7% volatility for my example here, because I’m going to do something extremely simplistic to show the effects of volatility — I’m going to pretend the volatility effect is that the return we got was one standard deviation below our expected (here, the 7.5%)
The thing is, volatility in percentage returns reduces over time, inverse to the square root of the time period.
(Yes, I know I’m simplifying things, assuming constant volatility, lognormal returns, blah blah blah. This is just to illustrate.)
So here are the volatility projections, assuming a constant 7% per year volatility, for the different time periods:
1 year: 7%
10 years: 2.2%
20 years: 1.6%
Not too shabby — the percentage volatility decreases, so our deviation from 7.5% will decrease.
Let’s look at the accumulation effect. Remember, for my simplistic illustration, I’m subtracting one standard deviation (the volatility) from the expected return. Let’s see what we end up with.
1 year: $1005 — a 7% decrease from expected
10 years: $1674 — a 19% decrease from expected
20 years: $3168 — a 25% decrease from expected
Notice that.
A relatively small deviation from expected return leads to a very large deviation in accumulated amount the longer your time horizon.
That’s why they’re having kittens over decreasing the assumed return on assets even 0.5%. Pension liabilities are very long-term. You’re putting in money now for someone who may not be retiring for decades, and then they are supposed to be taking income for decades.
A small change in discount rate can make a huge difference in effect. Small differences in return can have an outsize effect on how much you actually have accumulated.
I will note I keep using the phrase “discount rate”, because that’s what they’re doing to the liability cash flows to value them. Usually, they use the assumed return on assets as the discount rate. With changes in GASB, sometimes the discount rate is lower than that target asset return rate, but I’m not going to discuss that now.
How are the discount rates changing?
I made the following graphs using information from the Public Plans Database. I have updated this from the 2015 data I had been using.
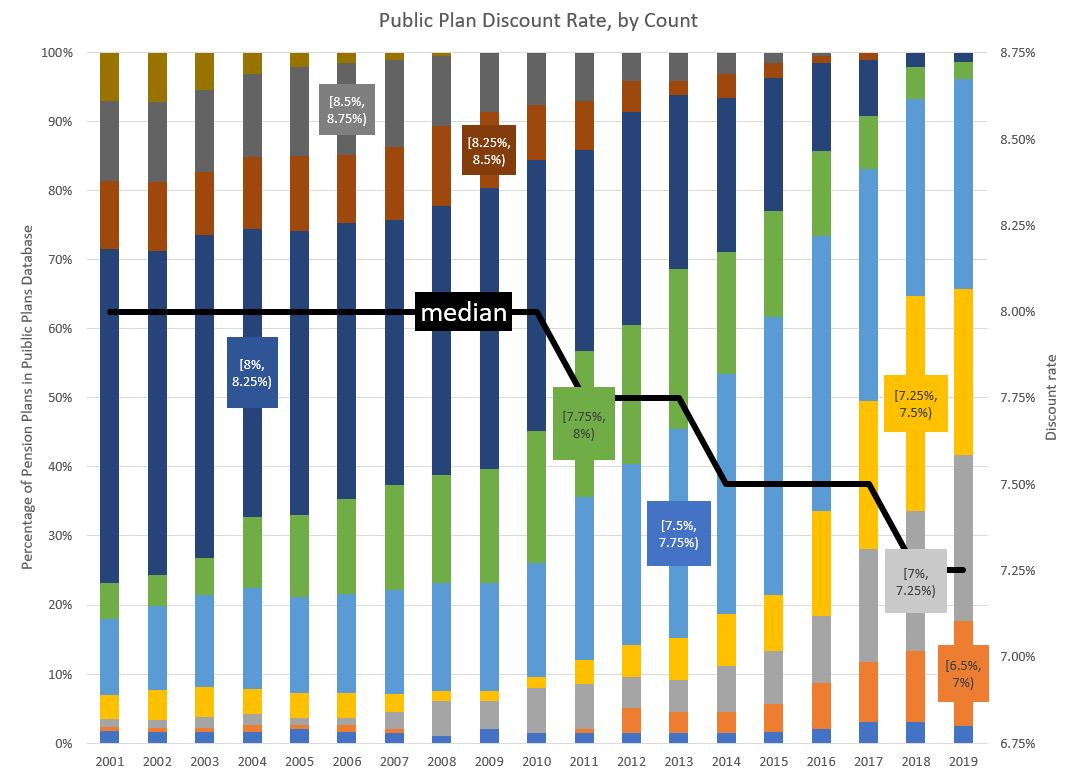
First, a look at discount rate choices over time, by count of plan:

I have overlaid the median rate by year, and note that I adjusted the secondary axis to try to get it to match up with what the bars are doing. I do have new ways of visualizing this, but I will save that for later. I did only mark some of the bars; I tried to fix on the most consequential ranges.
When I posted this back in 2015, I only had data up to 2014, and there had been only one movement for the median: from 8% to 7.75% in 2011. Since then, we’ve had two shifts in the median: down to 7.5% in 2014 (and I had thought that would happen), and down to 7.25% in 2018.
However, I wanted to know what really mattered – if a bunch of itty-bitty plans are using high or low rates, that doesn’t make much of a difference.
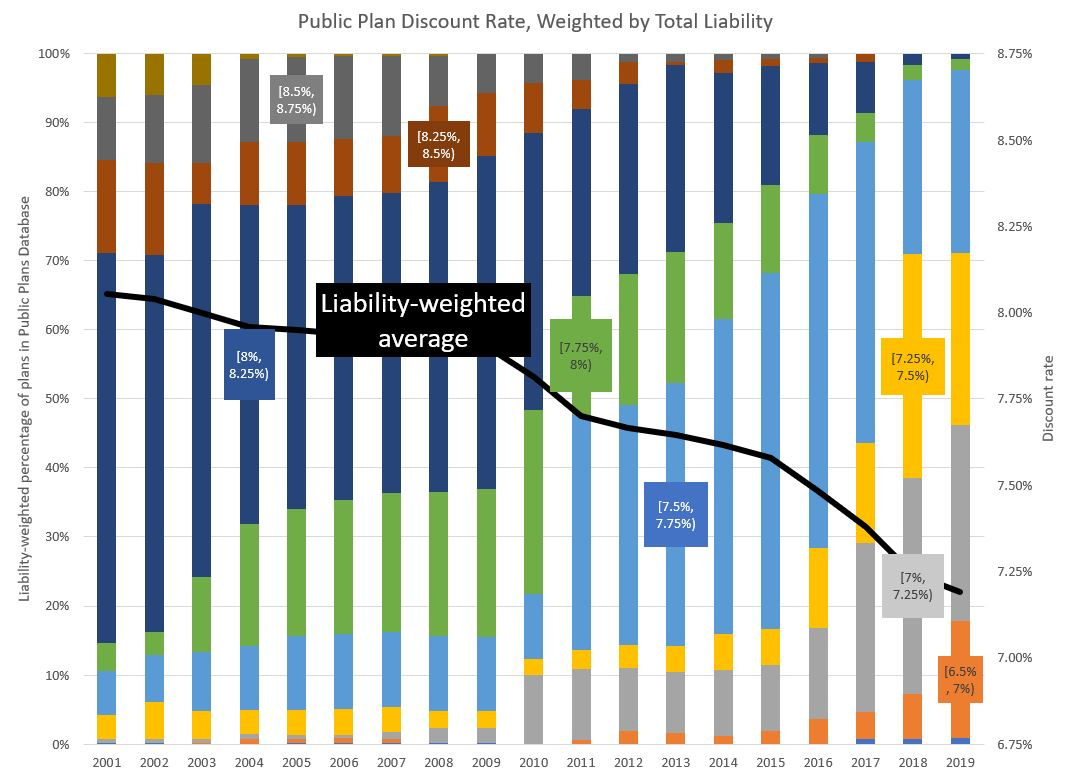
Here’s the graph weighted by liability (measured using that same discount rate, mind you):

I want to note one notable difference between the two graphs: you are more likely to see huge changes year-to-year in the liability-weighted graph, because when California changes its discount rate, it moves a lot of things. Just by itself, Calpers ranged from 7% to 10% of the total liability of all the plans covered in the graph. Calstrs is next in size, ranging from 5% to 6%. The NY state plans also are a good chunk. The difference can be seen most starkly from 2010 to 2011, when both Calpers and Calstrs went from 7.75% discount rates to 7.5%.
What does it mean?
First, many plans are indeed lowering their discount rates. It was true in 2015, but it kept on going, and is still ongoing. Part of the reason is that there was investment “underperformance” in all those bull market years before 2020. (And it is ugly now, but I need to address that in its own post later.)
While high discount rates make pension liabilities look smaller now, ultimately the investment experience does catch up.
Many know that even low-ish long-term volatility can mean some very large discrepancies.
It’s a bit amazing, but even politicians can grasp reality sometimes.
I intend to dig into what may be driving differences in discount rate choice, which has been the subject of lots of research. Some of it I consider silly, such as these guys at the Federal Reserve Bank of Cleveland trying to link masculinity to high discount rates and some which may not be so silly, like this paper from Villanova on the link between public pensions and political competition. But that’s a work in progress.
After an abysmal earnings season for many public pensions in 2015, we did see discount rates drop. Considering current public pension plan issues in 2020, I can see the discount rates continuing downward, even if sponsoring governments can’t really afford the increased contributions such valuations would “require”.
I certainly don’t expect discount rates to go up in the near term.
But hey, it’s been a nutty year.


