CDC Reports on 2023 U.S. Mortality Released: Period Life Expectancy Increases A Little, Still Below 2019
Slight improvements, as seen in preliminary mortality estimates
This week, the CDC released two reports on 2023 mortality, one on the general level of population mortality (with the population period life expectancy estimates) and one on drug overdose mortality. Let’s look at the first one right now.
Period Life Expectancy in 2023 Increased to 78.4 Years
Here is the report: Mortality in the United States, 2023

As usual, I will remind the reader that period life expectancy is an artificial construct to capture population mortality statistics. It helps us collapse a lot of information into a single number for one year so we can compare year-over-year mortality trends.
My preferred metric for such comparisons is the age-adjusted death rate (which we will also see below).
More explanation in this post:
That out of the way, let us look at the short-term (for an actuary) trend — through the pandemic.
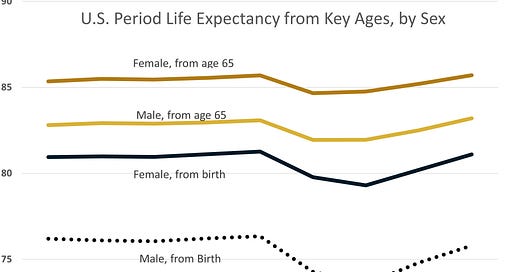
U.S. Period Life Expectancy from Birth 2015-2023
Here’s the graph:
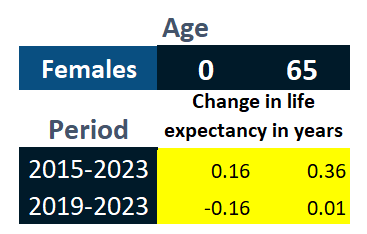
It can be difficult to see how period life expectancy has changed over this particular set of years, so I made a few tables:
So male mortality got worse over the entire lifespan, as seen both compared against 2015 and 2019.
I haven’t broken out the information, but I think it’s clear the increase in drug overdose deaths in young adulthood and early middle age has done a number on males in the U.S. There are other causes of death contributing to this, but this is a major one.
Note that for the over-age-65 life expectancy, things have improved both compared to 2015 and 2019, so one can say that senior mortality, broadly, has recovered.
For females, life expectancy from birth is a little less than pre-pandemic levels, so that there are still issues. Yes, the drug overdose deaths affect females in the U.S. as well.
It’s a wash for senior mortality for females. As I’ve seen earlier, Alzheimer’s mortality continues to climb — that’s primarily a female phenomenon.
Extending the Long-Term Trend
In this recent post, I graphed the U.S. period life expectancy by sex from various ages:
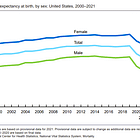
Here are the long-term trend graphs by sex:
Life Expectancy Spreadsheet
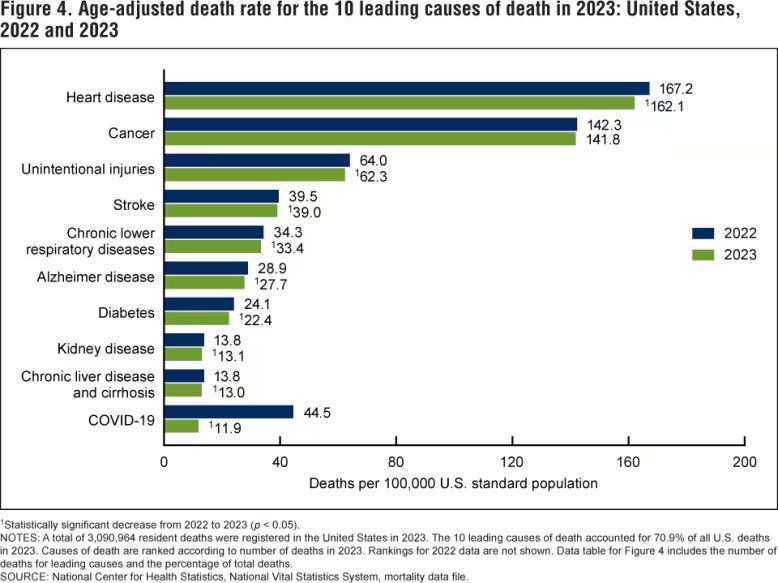
Decreasing Death Rates For Major Causes of Death in 2023

We knew this from earlier information (in my ranking tables, etc.)
I do want to pull out a factoid from the footnote in this chart:
The 10 leading causes of death accounted for 70.9% of all U.S. deaths in 2023. Causes of death are ranked according to number of deaths in 2023.
COVID-19 was at #10 in 2023, where it had been #4 in 2022 and #3 in both 2021 and 2020.
Here is the ranking table by year, with my preliminary counts in July: (these will be undercounts)
More here:
I was told that CDC Wonder data sets will be updated shortly, but as I’m headed out to inter Stu’s ashes in North Carolina and to do more Christmassy things, I may not get to updating all the mortality ranking tables, etc., until 2025. So, until then!


