A Contrast in COLAs: Social Security vs. Illinois
Small differences over 30+ years really add up
The leaves have changed color (or completely fallen off the trees) so that means it’s time for the Social Security Administration to announce the COLAs (cost-of-living adjustments) for benefits in 2021:
PLANSPONSOR: Social Security Announces COLA for 2021
Social Security and Supplemental Security Income (SSI) benefits will increase 1.3% in 2021, the Social Security Administration announced today.
The cost-of-living adjustment (COLA) will begin with benefits payable to more than 64 million Social Security beneficiaries in January 2021. The Social Security Act ties the annual COLA to the increase in the Consumer Price Index (CPI) as determined by the Department of Labor (DOL)’s Bureau of Labor Statistics.
…..
According to the Social Security Administration’s website, Social Security will typically replace about 40% of an employee’s pre-retirement income after retirement. It explains that this will be lower for people in the upper income brackets and higher for people in the lower income brackets.
Which is how the program has been designed for many years.
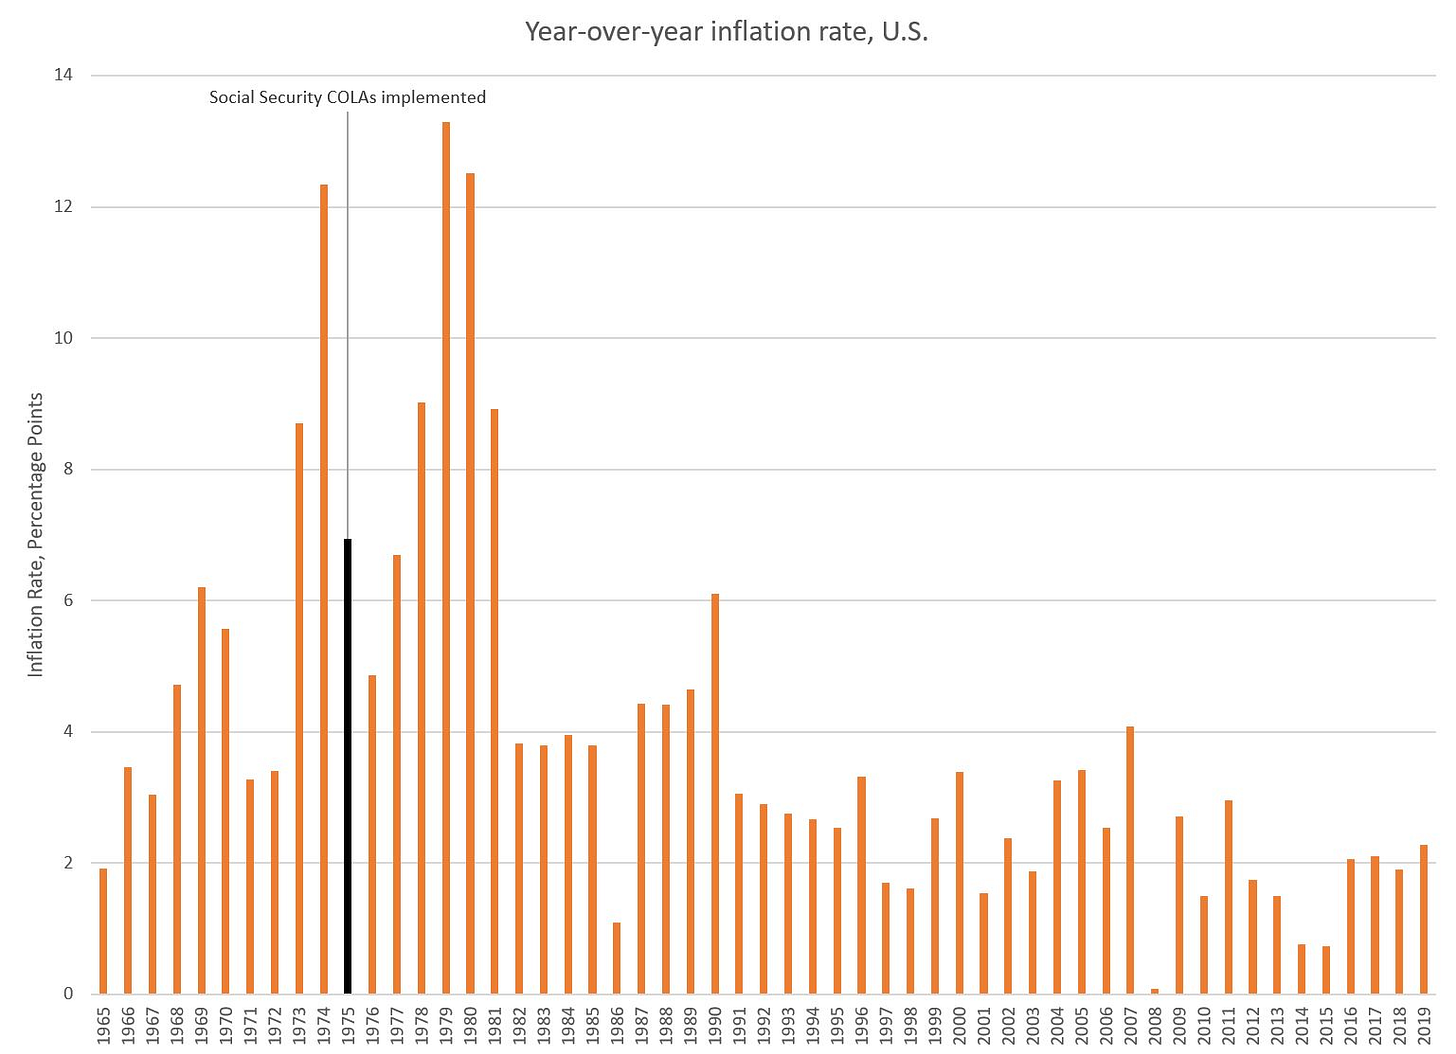
Social Security’s COLAs vary over time, based on CPI-U. Originally, COLAs were ad-hoc, and caused trouble for seniors in the high-inflation period of the 1970s. They became automatic in 1975, but inflation rates have been pretty low for a very long time.
Here’s a year-over-year inflation graph, starting in 1965 so you can see the years of high inflation preceding automatic COLAs.

Heck, you can see that inflation was even worse following automatic COLAs, so good thing they got that taken care of, eh? We will see what the actual COLAs were in a moment.
Illinois’s constant COLAs
Let us contrast the variable Social Security COLAs with what has been going on in Illinois.
Wirepoints: Gov. Pritzker ignores Illinois’ expensive COLAs as he pursues multi-billion dollar tax hike
Gov. Pritzker has no problem hitting up Illinoisans with tax hike after tax hike, but he won’t reform one of the richest public sector benefits in the country – Illinois’ automatic, compounded, 3-percent cost-of-living adjustments for pensions. Skyrocketing pension costs are overwhelming the state’s finances and COLAs are one of the biggest drivers.
COLAs drive up the cost of pensions in Illinois because they double a retiree’s yearly pension after 25 years. Since the state has nearly 500,000 active workers and beneficiaries who benefit or will benefit from this COLA, it’s easy to see why the state has racked up nearly $140 billion in officially-reported pension shortfalls.
…..
Illinois is a national outlier when it comes to COLA benefits. The state’s formula for increasing a retiree’s pension each year is simply overgenerous. A comparison of teacher pension benefits in Illinois vs. those in its peer states – Illinois’ five neighbors and the nation’s five largest states – makes that clear.
[go to post for comparison table]
…..
Illinois’ COLA started as a simple annuity increase of 1 percent. But several boosts by lawmakers have turned the benefit into a costly, compounded yearly increase that blows past inflation.1969: COLA increased to 1.5 percent simple
1971: COLA increased to 2 percent simple.
1978: COLA increased to 3 percent simple.
1990: 3 percent COLA increase compounded annually.
Okay, 1990 was when they imposed 3% constant compounding COLAs.
Let’s do a head-to-head comparison, shall we?
Comparing COLA rates
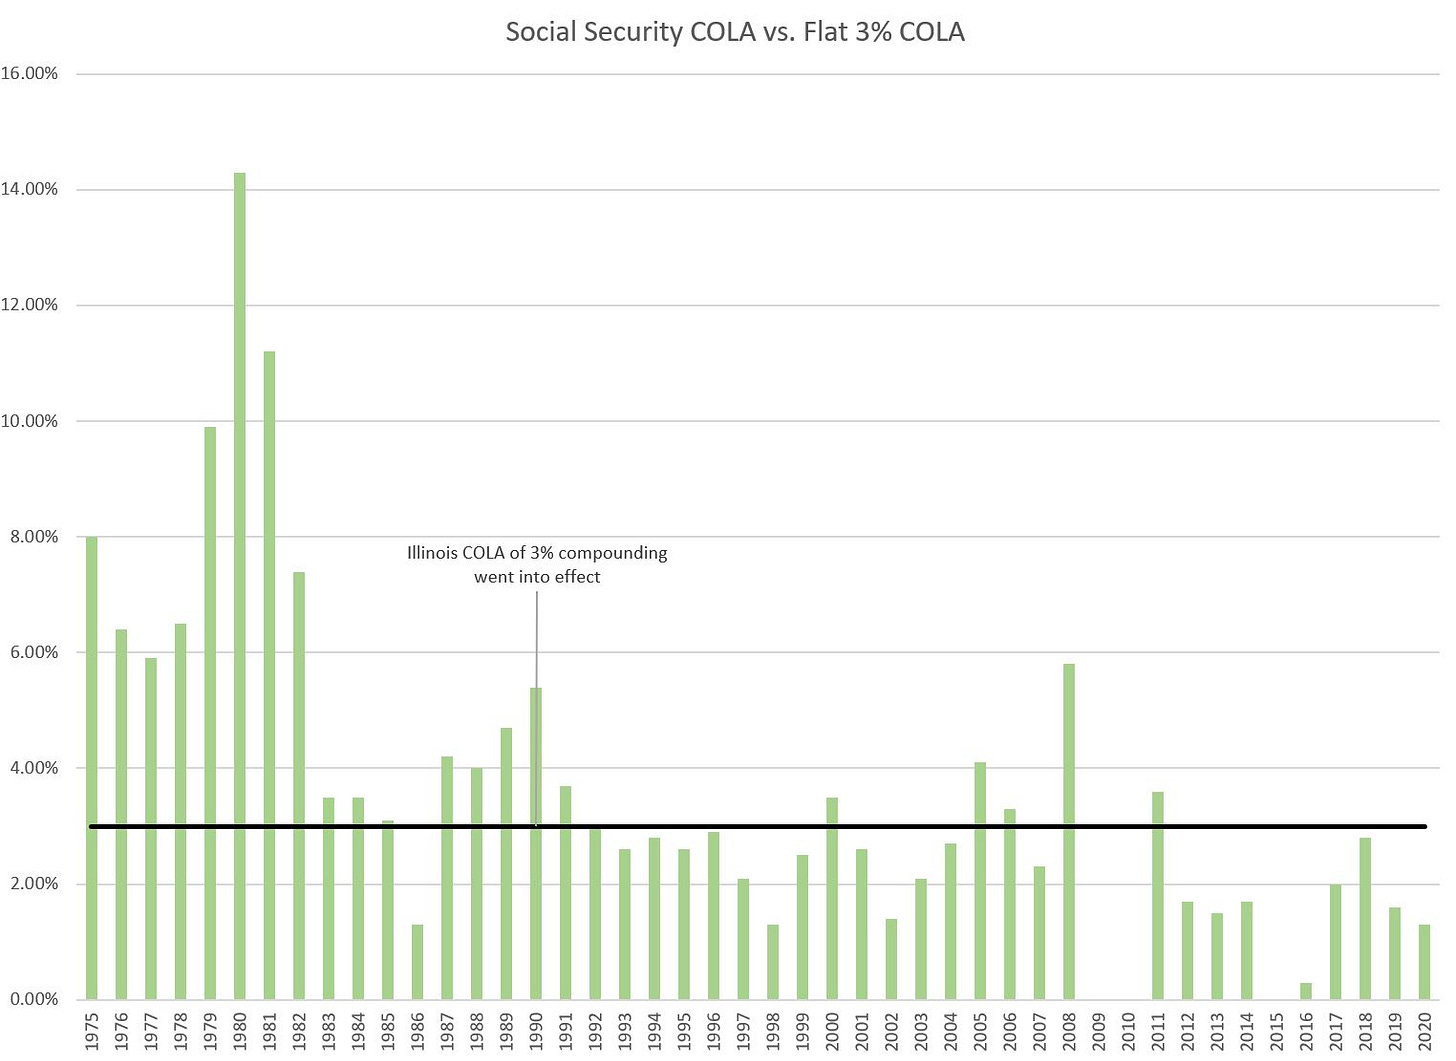
First, let’s just compare COLA rates from Social Security against that level 3% in Illinois. This is not over the same period – I will just overlay a 3% line against the Social Security COLA starting in 1975.

To note: before Illinois 3% compounding COLAs went into effect, Social Security COLAs were regularly well above 3%.
But after the 3% COLAs went into effect… not so much.
From 1990 to 2020 inclusive (31 years), Social Security COLAs were greater than or equal to 3% only eight times — that’s a little more than one-fourth of the time.
Comparing payment cumulative growth
However, that rate comparison is tough to see in how it translates into payment amounts.
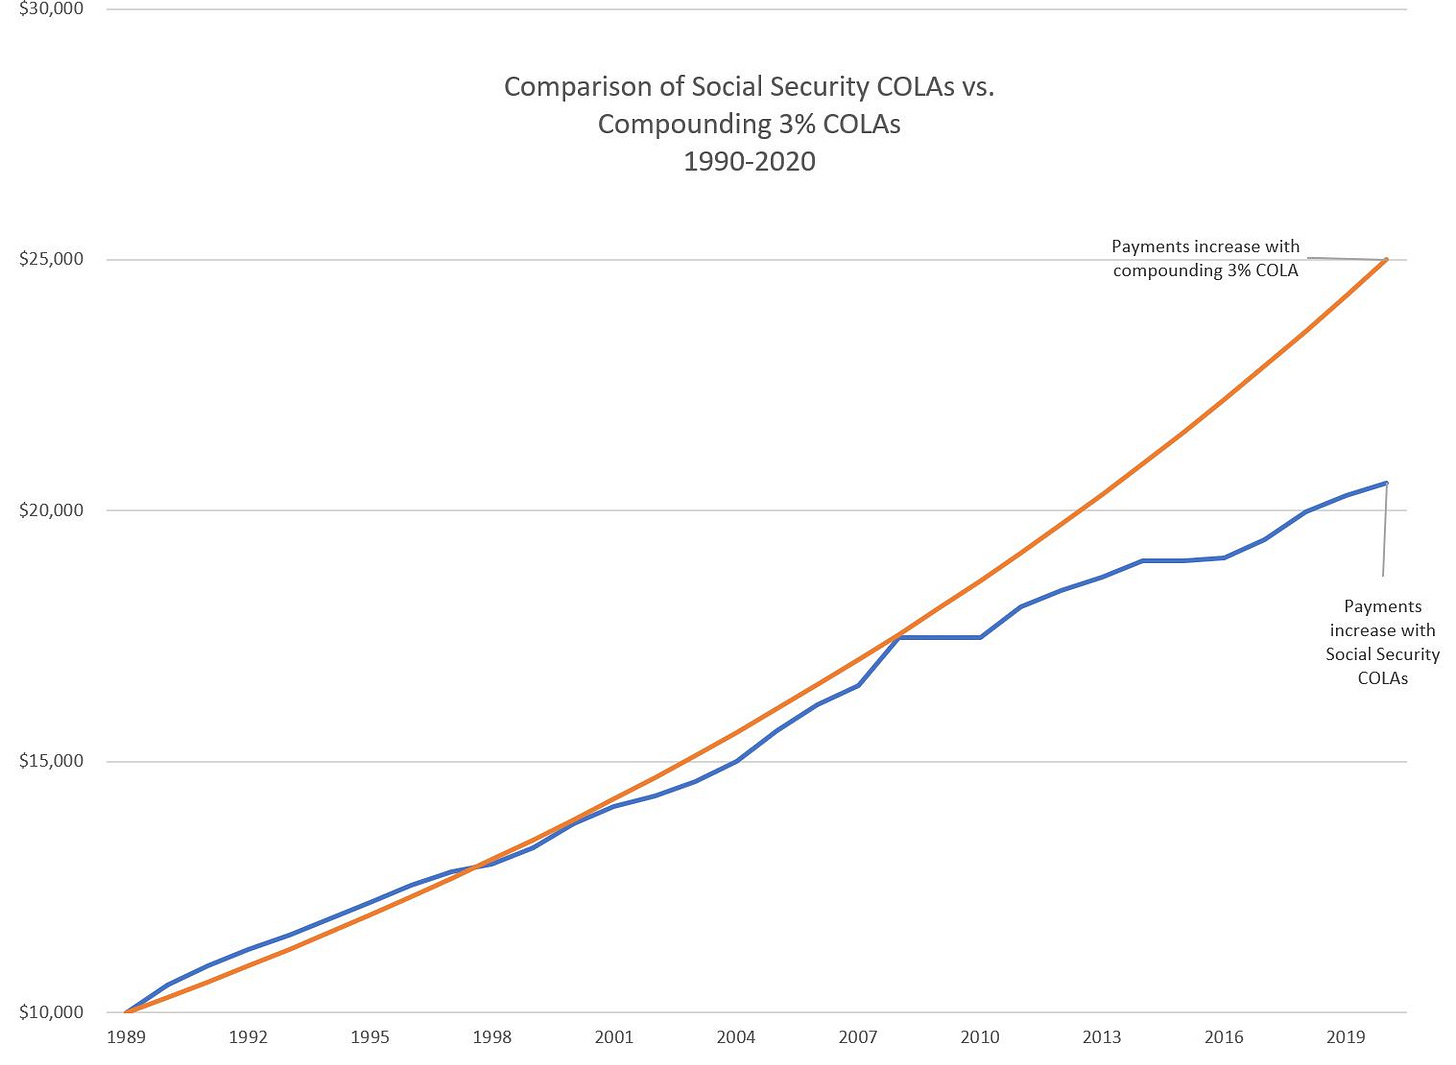
So now we’ll compare what happens to a $10,000 payment in 1989, and apply COLAs, both the Social Security and the constant 3% compounding, from 1990 through 2020.

From 1990 to 1998, the Social Security COLA effect exceeds that of the 3% constant COLA… and from 1998-2008, the payments stay pretty close.
But after 2008, the paths clearly diverge.
After 31 years of constant 3% COLAs, the initial payment has inflated into 2.5 times the original amount. That’s the magic of compounding, after all.
Given the inflation history, a constant 3% COLA didn’t sound outrageous in 1990, but it has really added up over the decades.
The Social Security amount more than doubled over the same period, but the constant 3% compounding leads to a payment of more than 20% than the Social Security COLAs compound to. That comes from an average 2.35% growth rate on the Social Security payments over 31 years versus 3% per year for 31 years.
Small differences can amplify into large ones over time.
Enjoy World Statistics Day!


