2022 Top Causes of Death in the U.S. by Age Group and Sex, Finalized
That took a little longer than I expected
In general, the finalized death statistics for a year are available about a year after a year is fully completed, so I originally expected to make this post in January 2024.
The results below are not going to be very different from what I posted provisionally in July 2023, including the sex-distinct rankings. Let’s update them all!
Top-level ranking of causes of death
One of the new things I’ve done is highlight diabetes and kidney disease. Yes, I know liver disease is also doing some funky things through the pandemic, but I want to highlight the increases in kidney disease death specifically. I will have more to write about kidney disease and diabetes in later posts.
Top Ranking Causes of Death by Age Group, Counts
One thing to keep in mind with rankings, of course, is that they are influenced by what is considered “rankable”.
This comes up every time, but I do not decide what are “rankable” causes of death. I’m using the CDC’s list of “113” causes (not all of which are marked as rankable). All of the different types of cancer are put together. “Accidents” contains a whole bunch of unrelated causes, such as accidental drug overdoses, motor vehicle accident deaths, drownings, falls, lightning strike deaths, and on and on. Flu and pneumonia are lumped together.
As well, just by the approach I take, I am not allowing two causes to share a ranking, but you can see flu/pneumonia and COVID have the same number of deaths for ages 5-14. The tie-breaker here was just a code you don’t see orders flu/pneumonia before COVID in ABC order (which is unsurprising — COVID is a late-comer, so gets a later code).
When one ranks, a lot of the ranked causes are very close in number/rate. Some are far apart. COVID, to just pick on one cause, is a much-higher-ranked cause for the age 75-84 group, but you see the number and the rate is much higher for the age 85+ group.
There are a lot of numbers flying by here, so I do recommend picking a single cause of death and looking across all the ages, both in terms of numbers and rates.
But also look down a single column. Make comparisons against the actual numbers, and not just whether one is higher-ranked than another. You will find some are quite close while others are orders of magnitude different in impact.
Top Ranking Causes of Death by Age Group, Rates
When done by rate, one can really see differences now.
A cause of death may be lower-ranked for a specific age group, but at a much higher rate of death for older ages. When the overall death rate is high, as with the age 85+ group, it takes a fairly high death rate due to a cause to rank.
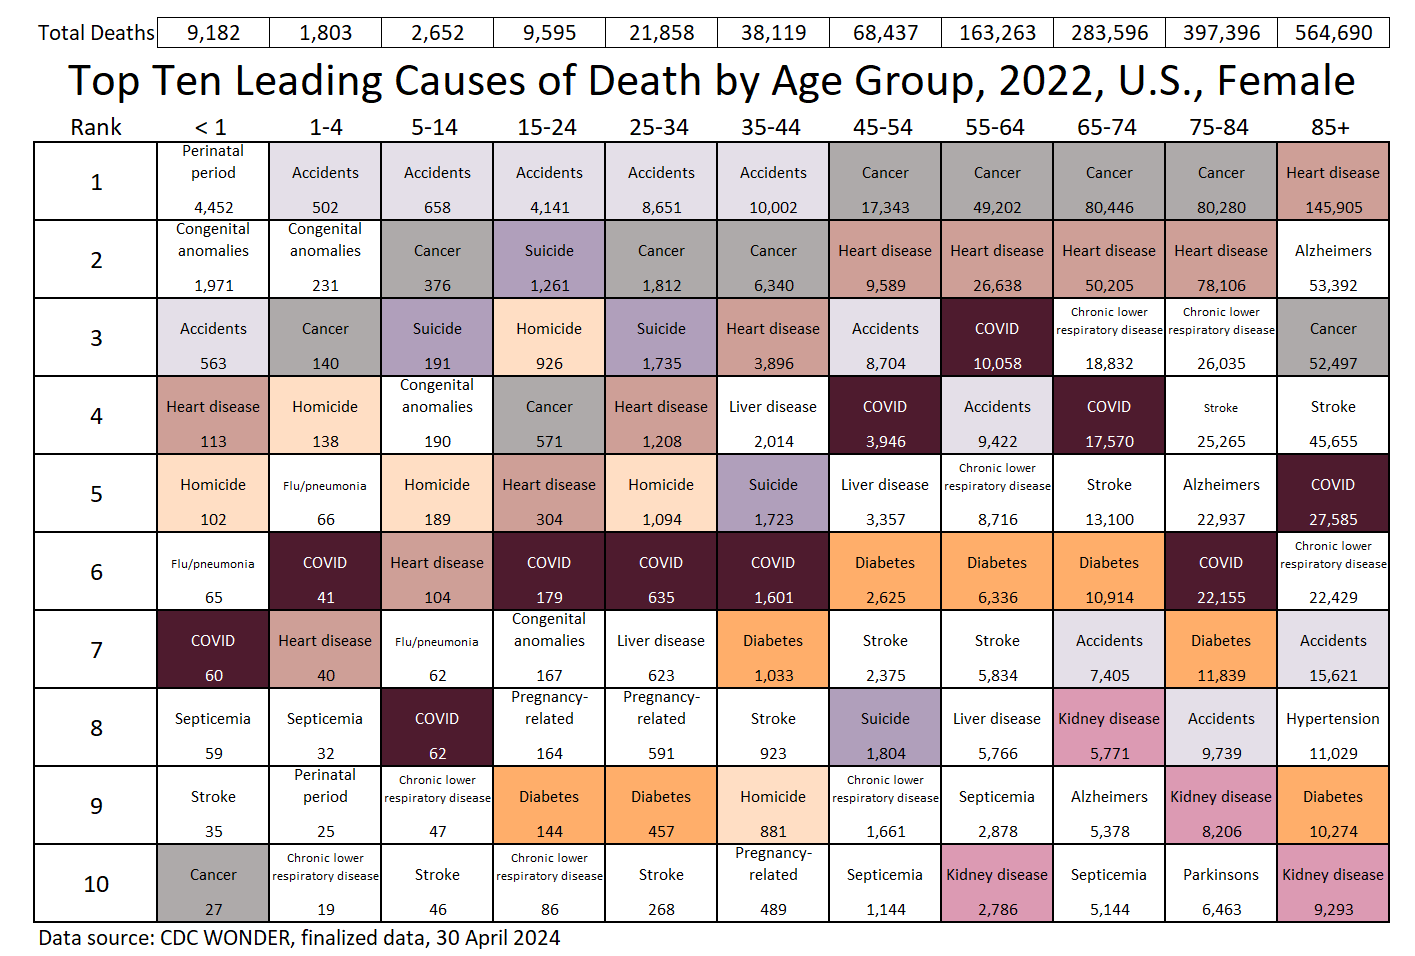
For the remainder of this post, I’m will post the sex-distinct tables without commentary. This is so I can have all the tables here for reference to link in future posts.
I will discuss these later in their own posts, because you will notice the “shape” of mortality differs by sex.


