


2021 U.S. January-June Cause-of-Death Ranking Table
Everything's provisional.... but it will probably not move too much

I’ve just been having too much “fun” with CDC WONDER of late.
As I’ve noted before, there is a lag in death reporting, and for sensitive causes of death (like suicide, homicide, and drug overdoses), there is an even longer lag. That said, the data for the first 6 months of 2021 are pretty solid, so let’s do a ranking table for January - June 2021:

For convenient comparison, here is the full year 2020 table, with death totals up top:
And prior related posts:

The shifting impact of COVID deaths to not-quite-as-old ages
There had been some shifting on the age range impacts for COVID deaths, once vaccines started to have effects in the January 2021 peak, and as the oldest folks had first access to vaccines. I also saw the age-shifting in the COVID deaths as per this post in December:
Here’s the relevant graph:
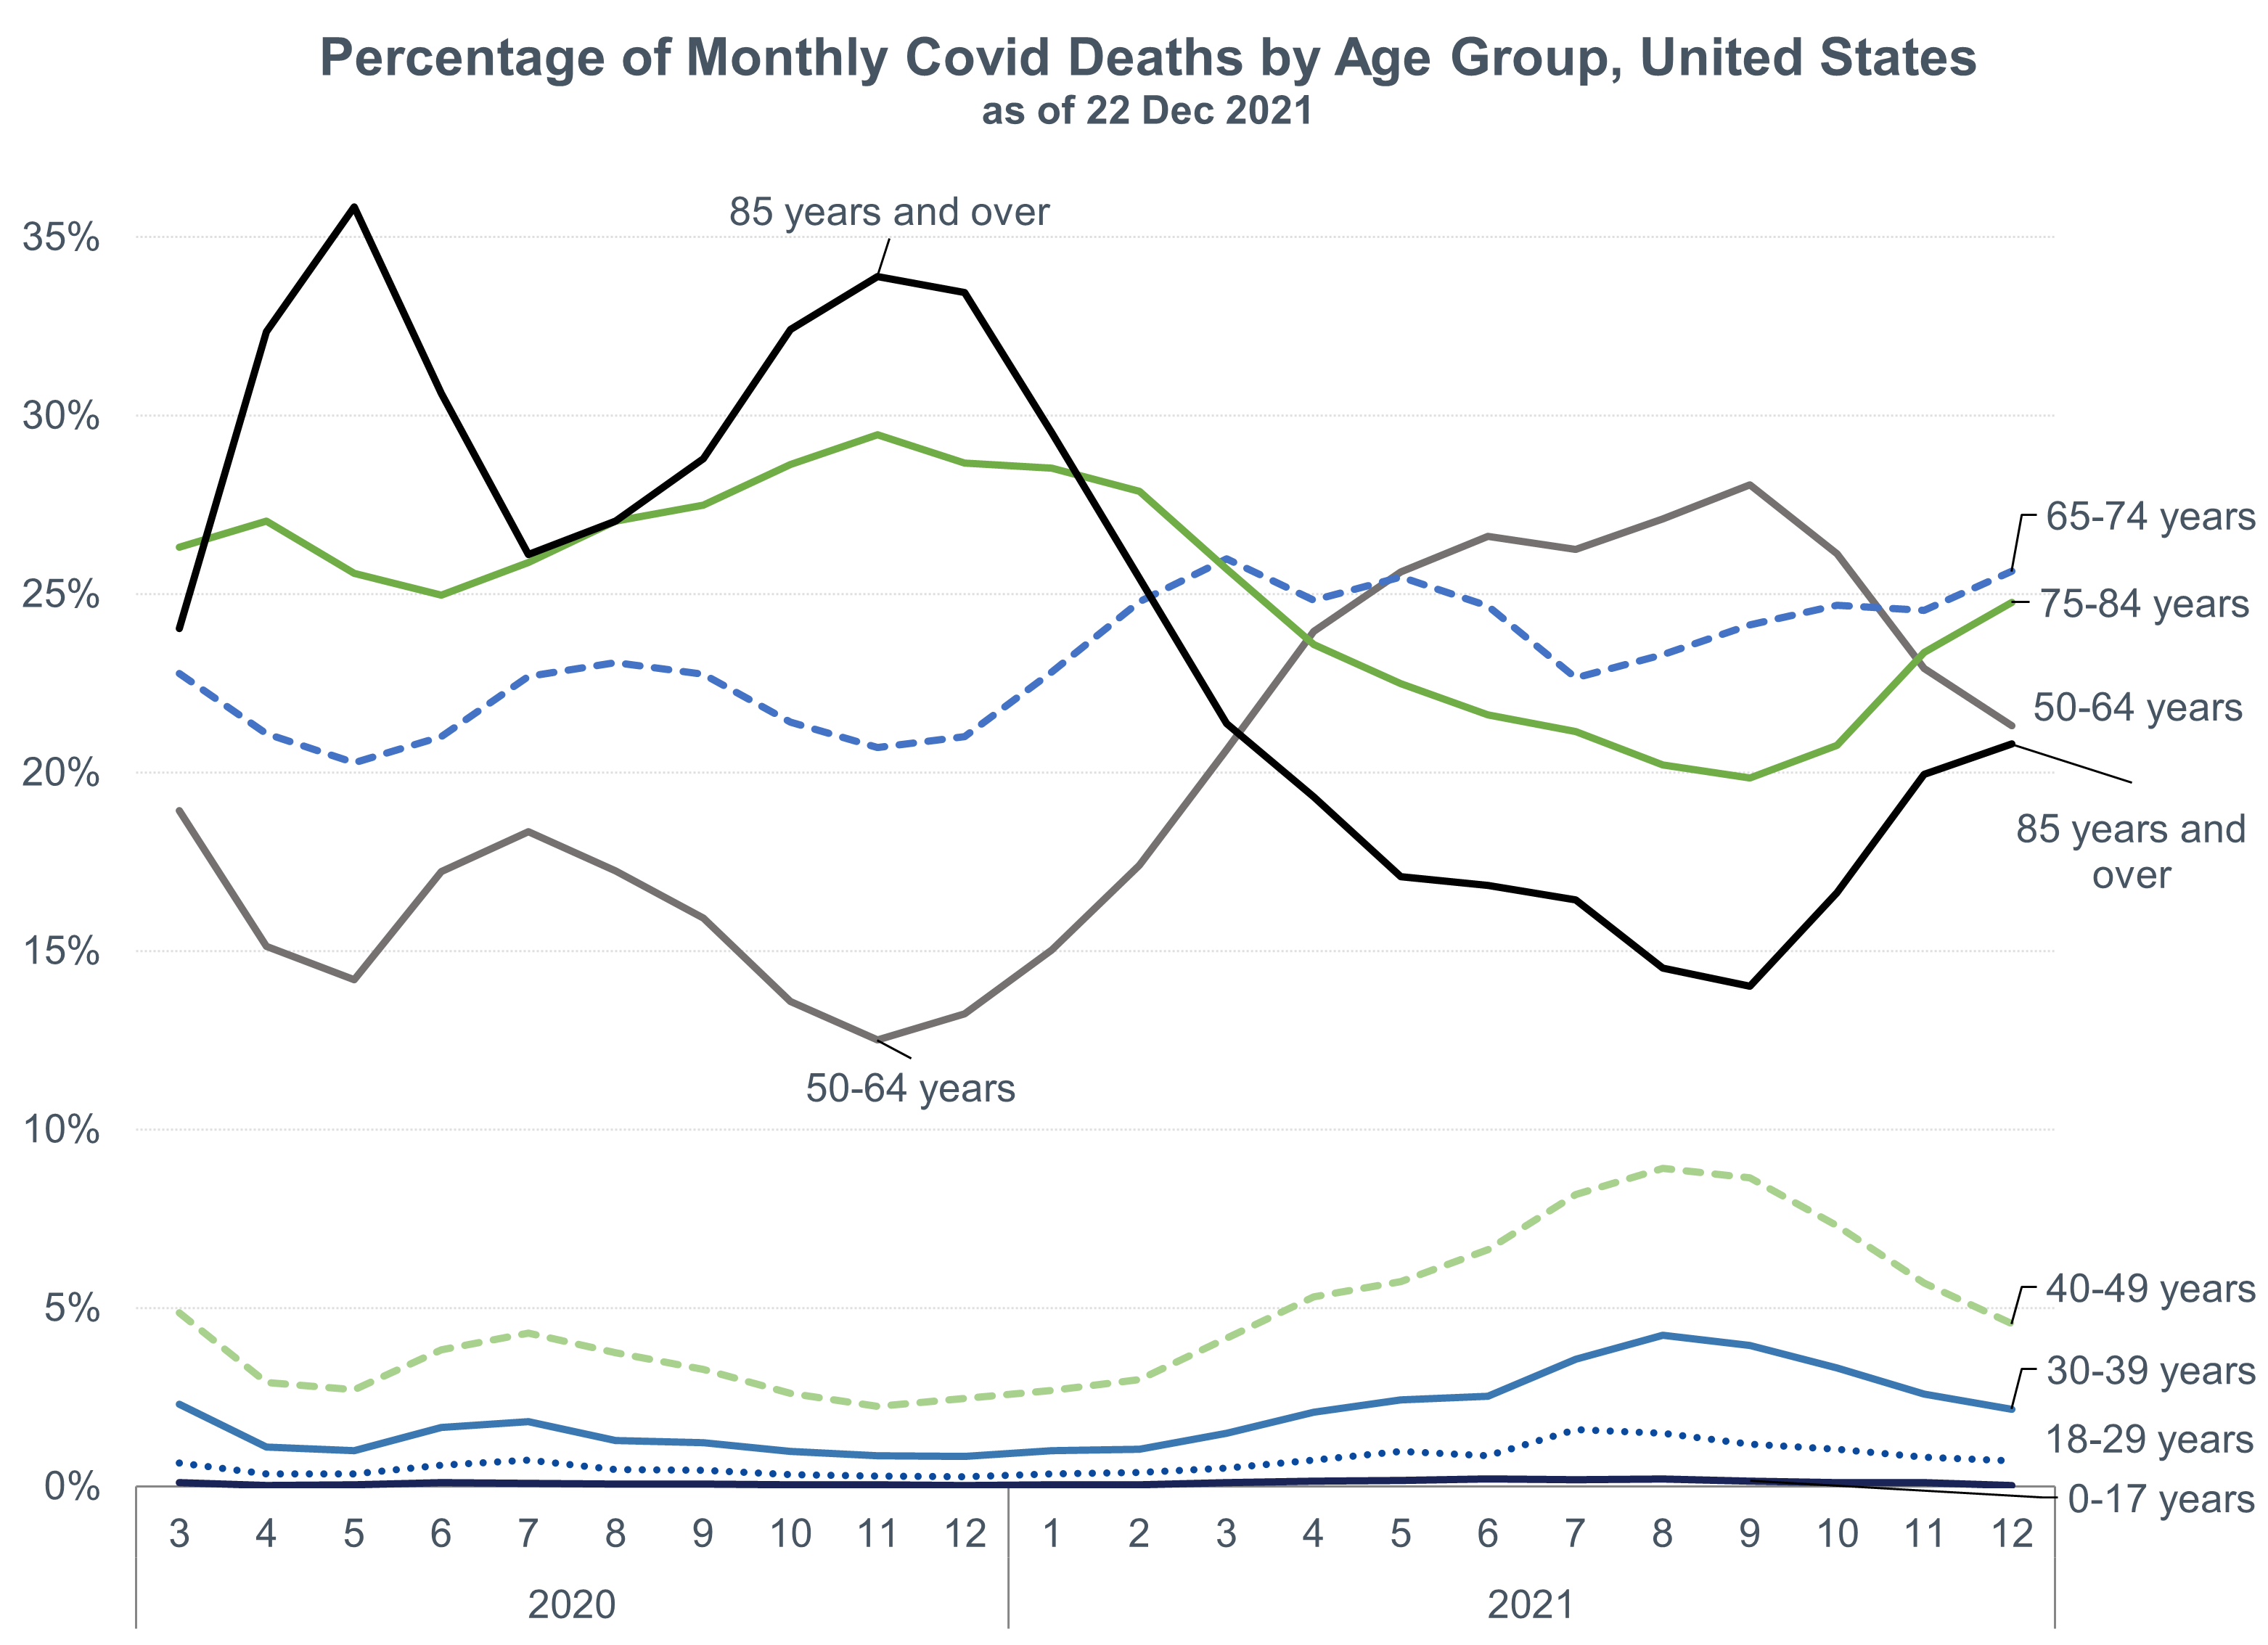
I don’t feel like updating the graph for updated #s in November and December, because my ranking table only goes through June, and those percentages haven’t budged.
But we can see that the burden of COVID shifted to “younger” groups of old folks, away from the 85+ group, when we just look at the number of people dying from COVID. When we look at rates, the rates for age 85+ almost definitely will still be higher, even after vaccines, because there wasn’t a lot of delay between when the really old and the merely old could get shots.
Remember that Baby Boomers are in the age 65-74 bin, as well as straddling both younger and older age groupings. The number of people dying is a combination of the rates and the number of people available to die — there are a lot more people in the Baby Boomer generation around than in the Silent Generation, just from more Boomers being born… and more still alive after all these years. See this old post where I explained to my grandma (born in 1929) why she saw so many more obits of people 20 years younger than her than of people her age (grandma has since died….I was the fun grandchild.)
Any Conclusions Yet?
Kind of.
I don’t recommend simply doubling the numbers from the ranking table and comparing them to the 2020 table, especially for the COVID numbers. I know that won’t work, because of the overall 2021 mortality trend we saw:

However, I have been making estimates and projections, and I see some really worrying numbers for the ages 15-44 grouping, especially for external causes of death: suicide, homicide, and accidents. The worrying trend is that these may extend past the time COVID mortality wanes. It looks worse for 2021 than for 2020.
I will be doing posts looking at these three large categories, starting with suicide, in upcoming posts, by more detailed demographics than just age. Some of these trends have geographic components to consider as well.
Underlying spreadsheets and data:
Enjoy!